

The State of Northwest Minnesota's Labor Market: Loosening but Not Unraveling

By Anthony Schaffhauser
Key Takeaways
- Unemployment is relatively high but not alarming. The unemployment rate from January through April of 2026 is the highest of the decade so far for both Northwest Minnesota and the state. But context matters: conditions now resemble 2015, when the labor market had fully recovered from the aftermath of the Great Recession.
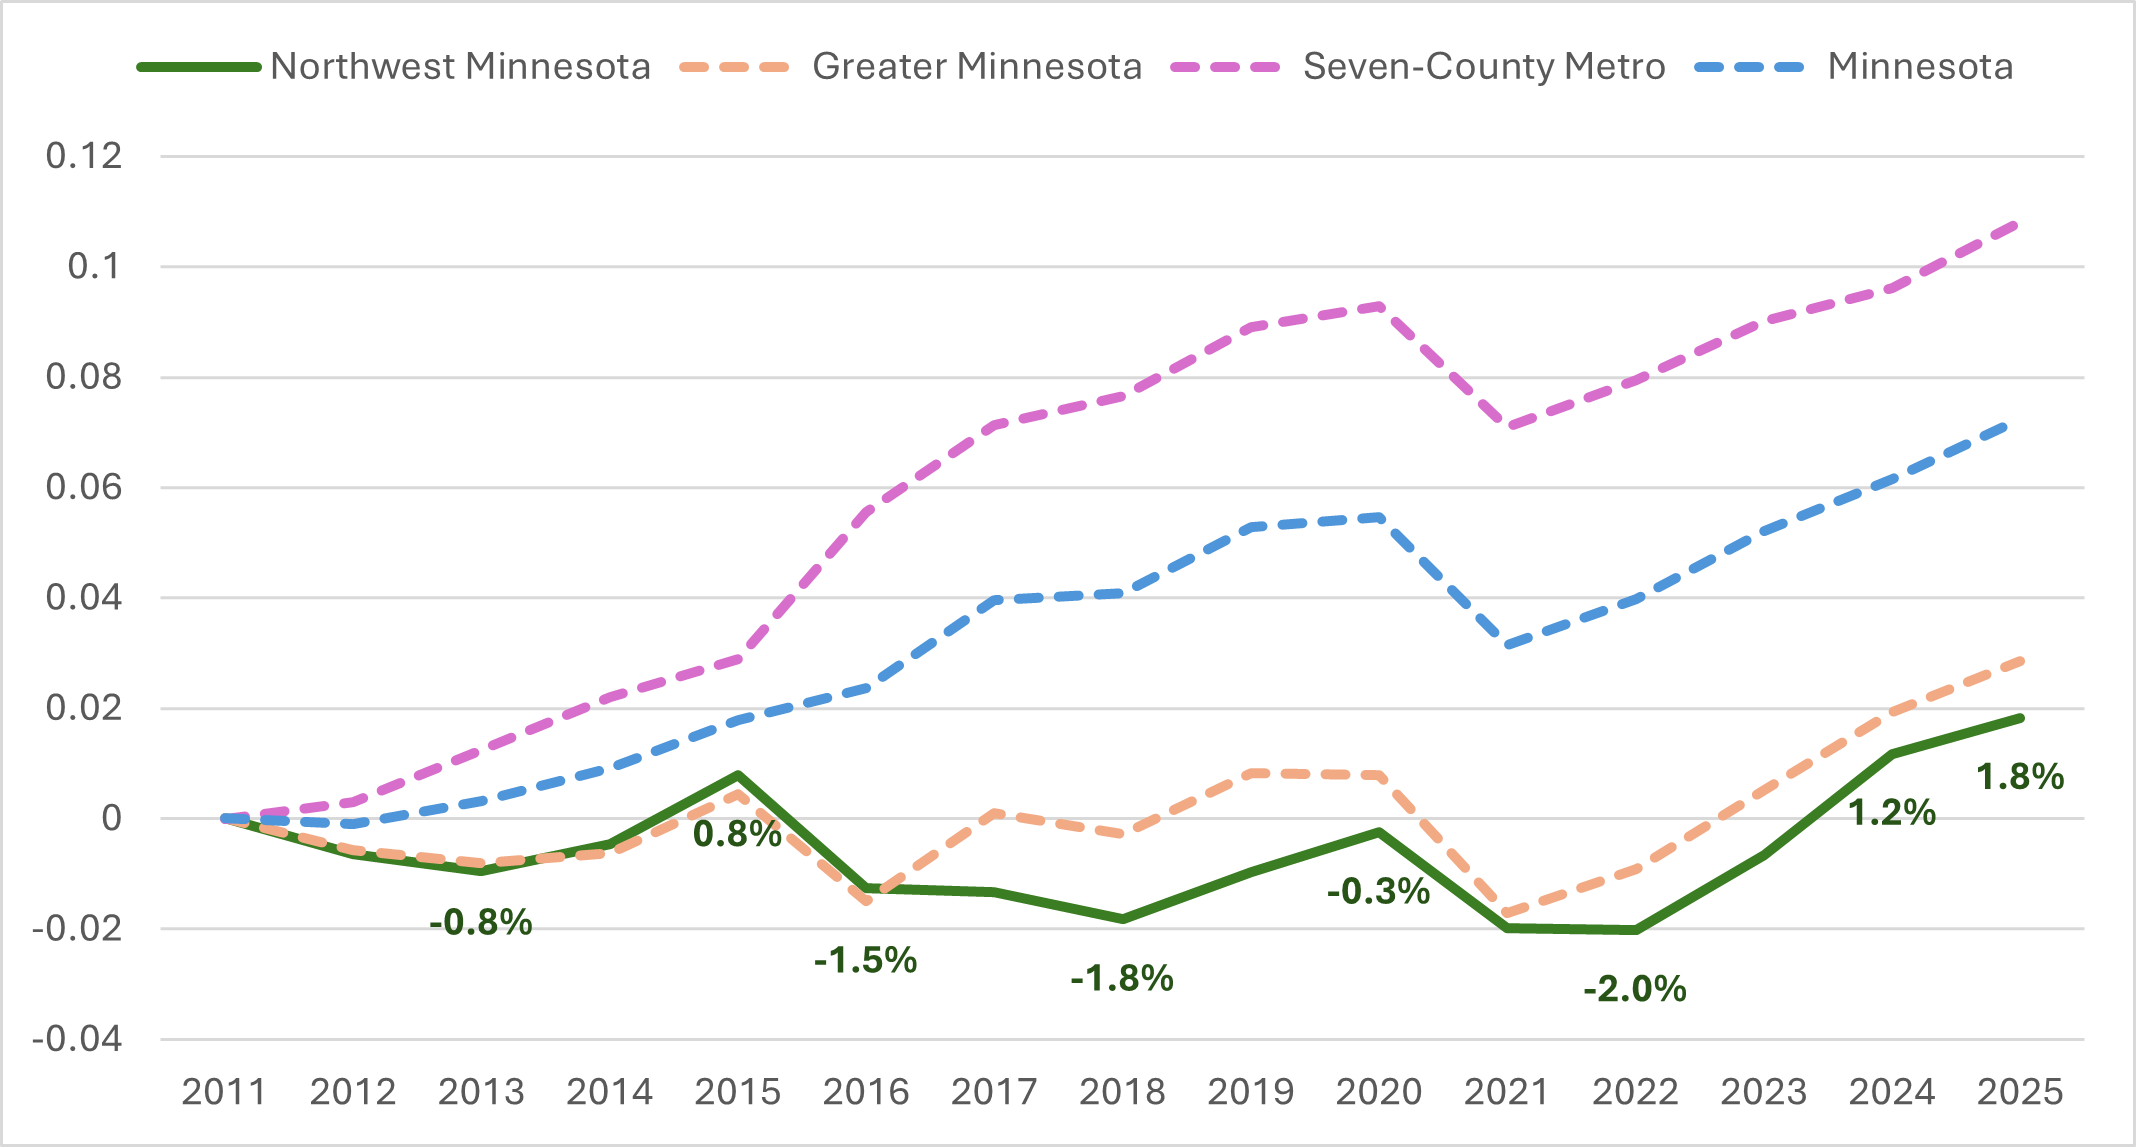
- Northwest Minnesota's labor force is at a decade-plus high. At 303,860 in 2025, the region's labor force exceeded its pre-pandemic peak for the first time, growing 1.8% above 2011 levels.
- Labor force growth, not job loss, is boosting labor supply. Permanent layoff claims in early 2026 were below 2018 levels. Meanwhile, an influx of new workers grew the labor force: Net migration added an estimated 2,697 prime working-age residents from 2020 to 2024.
- 2025 brought the first job decline in five years. Northwest Minnesota employment fell 0.5% in 2025 after four consecutive years of growth, shedding 1,099 jobs. The decline was concentrated in manufacturing and trade — sectors sensitive to consumer spending curtailment and business investment downcycles.
- Health care leads job growth, but it's more demographic than economic. Health Care & Social Assistance added 2,536 jobs from 2023 to 2025 (+6.5%), driven by the region's older-than-average population rather than broader economic momentum.
- Manufacturing is the most significant warning sign. The sector shed nearly 1,500 jobs (-4.9%) from 2023 to 2025, led by transportation equipment (-18%), including recreational vehicle manufacturing.
Introduction
Northwest Minnesota's unemployment rate is rising, and 2026 is off to its highest start of the decade. If you stop there, the story sounds alarming.
But a single labor market data point rarely tells a true story, and this time is not an exception. Beneath the headline unemployment rate lies a more complicated and, in important ways, more encouraging picture: the Northwest labor force is larger than it's been in over a decade, swelled by in-migration of working-age residents into a region with a formerly flat labor force trend. Increasing unemployment along with labor force growth is healthy.
That said, healthy doesn't mean invulnerable. Industry employment data from 2023 to 2025 reveal two parallel economies taking shape in the region. One is a demographically driven expansion in health care, which is durable, structural, and essentially guaranteed to continue as the region's population ages. The other is a broad softening in manufacturing, trade, and other cyclically sensitive sectors that materialized in 2025.
Together, the unemployment rate data, labor force trends, and industry employment figures tell the story of a labor market and economy navigating a genuine inflection point heading into mid-2026.
A Rising Unemployment Rate in Context
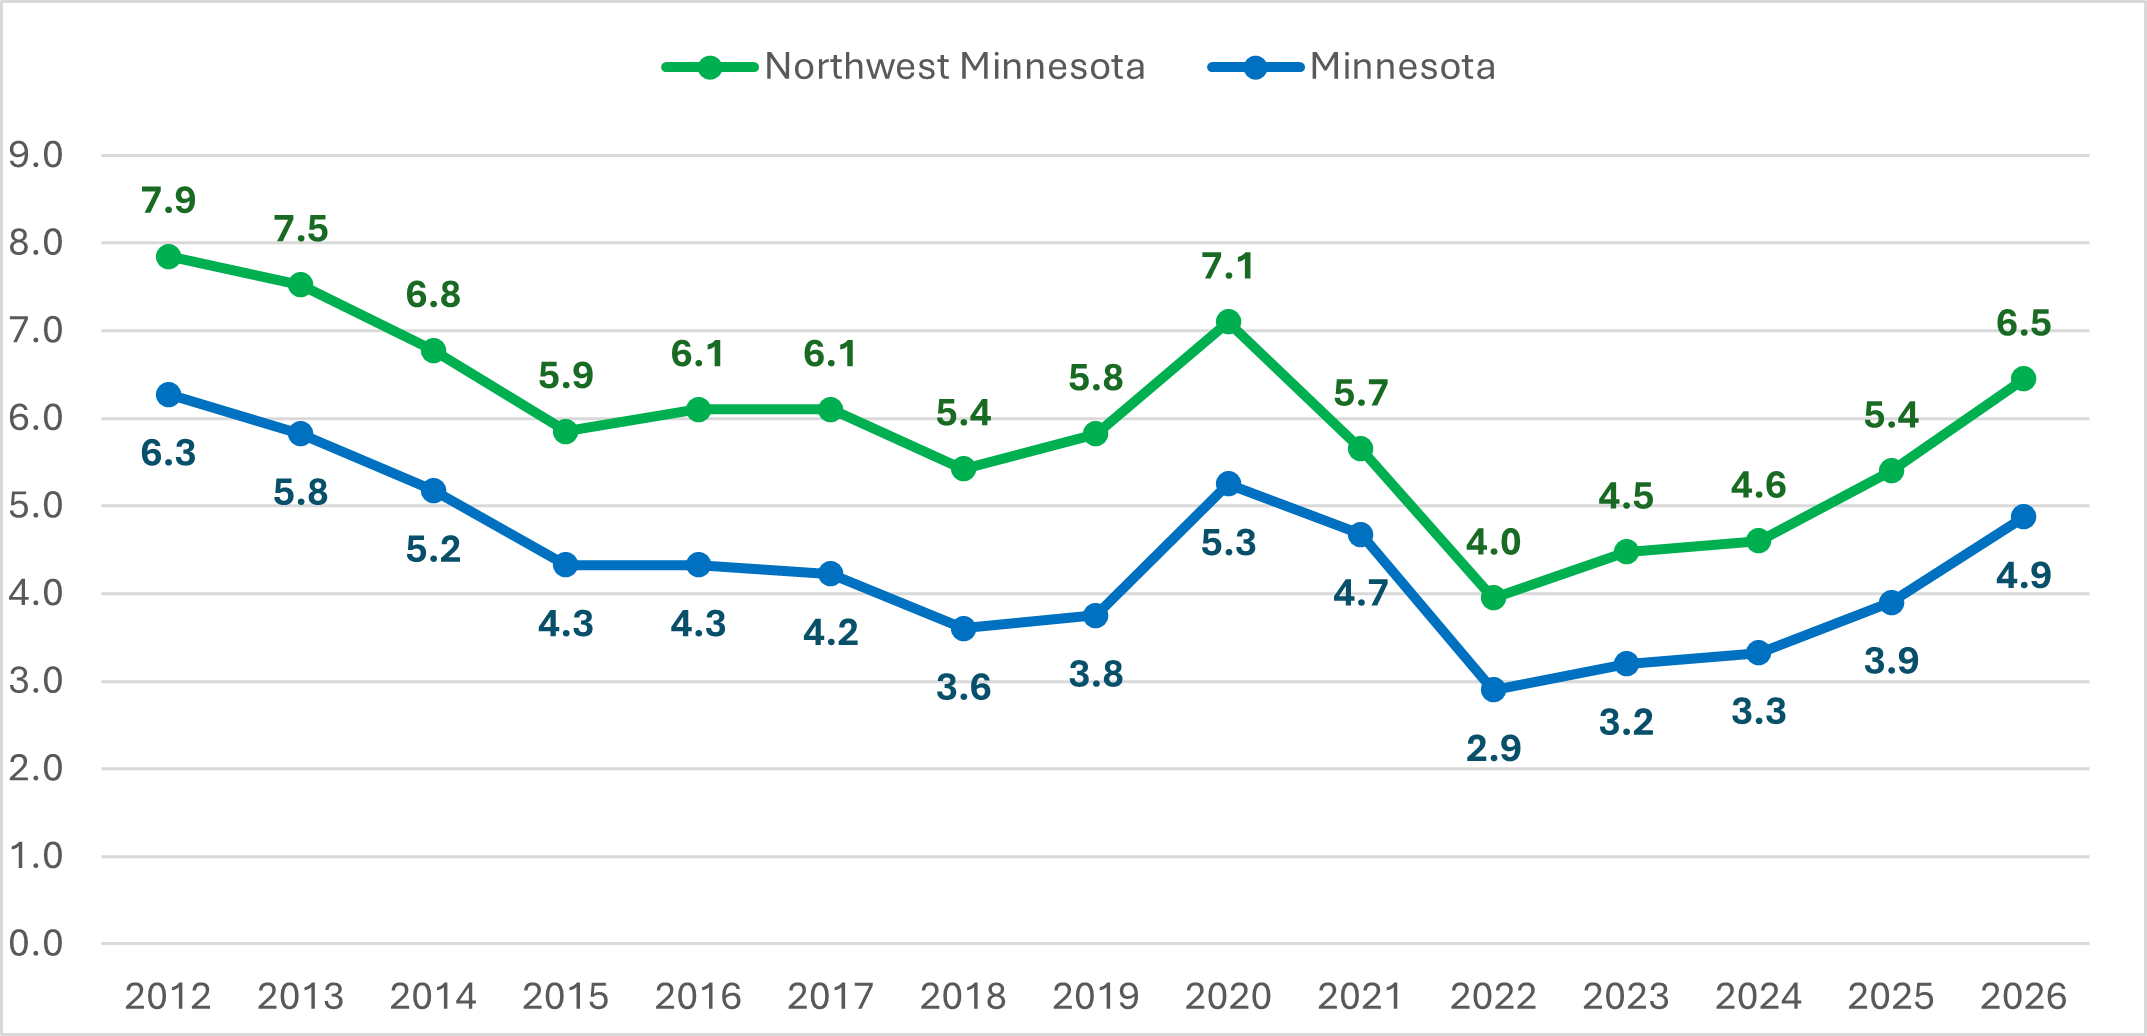
The unemployment rate in Northwest Minnesota and Minnesota statewide has been trending up over the past couple years, signaling a loosening labor market. Granted, it was at a historic low in 2022 when the pandemic recovery was in full swing. But 2025 unemployment rates now exceed the rates in 2017 through 2019, both in the Northwest and Minnesota statewide.
So far in 2026, the average January through April unemployment rate has accelerated over the past two years (Figure 1). In 2026 it's the highest of this decade for both Minnesota and the Northwest. The last time it was higher was 2014, as the labor market was still steadily improving in the aftermath of the Great Recession of 2009.
Figure 1: January to April Average Unemployment Rate, 2012 to 2026
Source: DEED Local Area Unemployment Statistics (LAUS)
Figure 1 also shows the gap between the Northwest and Minnesota unemployment rates widening since 2022. However, the Northwest labor market is not loosening more than statewide. Instead, it was relatively tight compared to statewide during the pandemic recovery and relatively loose compared to statewide from 2016 to 2019.
The Northwest's January to April unemployment rate was unusually close to Minnesota's in 2021, with a mere 1-point difference, and had only a 1.1-point gap in 2022 (see last column of Table 1 below). The spread then increased to 1.3 points in 2023 and progressed to 1.6 points in 2026. From 2016 to 2019, the Northwest ranged from 1.8 to 2.1 points higher than Minnesota, averaging 1.9 points higher. From 2012 to 2015, Northwest averaged 1.6 points higher, which is where it was again in the first four months of 2026.
So, Northwest's increasing unemployment rate spread since 2022 is not telling us that the Northwest's labor market is performing progressively worse than statewide. Instead, it was performing historically better coming out of the pandemic and is now returning to baseline. The pandemic outperformance can be largely attributed to the Northwest's greater reliance on goods-production, which was less affected than services by the pandemic.
This spread is smaller for annual average unemployment rates, especially since winter affects employment more in the Northwest than the rest of the state. The advantage of considering January to April unemployment rates is to show that the spread has recently increased, but the overall trend is corroborated by the annual data (Table 1).
| Year | Annual Northwest Minnesota (A) | Annual Minnesota Statewide (B) | Difference (A-B) | Jan. - April (from Figure 1) Difference |
|---|---|---|---|---|
| 2012 | 6.4 | 5.6 | 0.8 | 1.6 |
| 2013 | 5.9 | 5.0 | 0.9 | 1.7 |
| 2014 | 5.1 | 4.3 | 0.8 | 1.6 |
| 2015 | 4.7 | 3.8 | 0.9 | 1.5 |
| 2016 | 5.0 | 3.9 | 1.1 | 1.8 |
| 2017 | 4.5 | 3.5 | 1.0 | 1.9 |
| 2018 | 4.1 | 3.0 | 1.1 | 1.8 |
| 2019 | 4.4 | 3.3 | 1.1 | 2.1 |
| 2020 | 6.3 | 6.3 | 0.0 | 1.9 |
| 2021 | 4.0 | 3.7 | 0.3 | 1.0 |
| 2022 | 3.0 | 2.5 | 0.5 | 1.1 |
| 2023 | 3.4 | 2.8 | 0.6 | 1.3 |
| 2024 | 3.7 | 3.1 | 0.6 | 1.3 |
| 2025 | 4.7 | 3.9 | 0.8 | 1.5 |
| 2026 | TBD | TBD | TBD | 1.6 |
| Source: DEED Local Area Unemployment Statistics (LAUS) | ||||
From 2012 to 2015, Northwest's unemployment rate was 0.8 points to 0.9 points higher. From 2016 to 2019 it was 1.0 to 1.1 points higher. In 2020 it was the same as the statewide rate (although with the pandemic hitting in mid-March, the January to April unemployment rate was still in the 2016 to 2022 range). From the 2020 low, the spread progressively increased to 0.3 points in 2021, 0.5 in 2022 and 0.6 in both 2023 and 2024. In 2025 it was back in the 2012 to 2015 range at 0.8 points higher.
So, this pattern is not a quirk of winter. Northwest labor market conditions since the pandemic are now tracking Minnesota and are distinct from the relatively looser conditions of 2016 to 2019 and the relatively tighter conditions of 2021 to 2024. Moreover, both the Northwest and Minnesota are currently in labor market conditions similar to 2015.
The bottom line is that the unemployment rate data show us that Northwest Minnesota's labor market has progressively loosened, along with Minnesota's, to a condition more like 2015, when the labor market recovery from the Great Recession aftermath finally completed. Furthermore, the relative condition of the Northwest's labor market compared to Minnesota's is more like the period from 2012 to 2015: not relatively tight as during the pandemic and recovery, and not relatively loose as from 2016 to 2019. The unemployment rate, then, tells us where the labor market has been. To understand why it's rising now, we need to identify labor supply trends.
A Labor Force at Its Largest in More Than a Decade
A rising unemployment rate can mean two very different things. It can signal a weakening economy where job losses are pushing workers onto the unemployment rolls. Or it can reflect a growing labor force, where more workers are entering or returning to the market than the economy can immediately absorb, even in healthy conditions. In Northwest Minnesota right now, the evidence points strongly to the latter.
The region's labor force reached 303,860 workers in 2025, its largest total since at least 2011, and the first time it has meaningfully exceeded its pre-recession level (Figure 2). That milestone is easy to overlook in unemployment rate headlines, but it matters enormously for how we interpret the current labor market. After more than a decade of essentially flat or declining labor force counts – the Northwest's labor force was actually smaller in 2022 than in 2011 – the region has turned a demographic corner.
Figure 2: Cumulative Labor Force Growth: Northwest Minnesota, Greater Minnesota, the Seven-County Metro, and Minnesota, 2011 to 2025
Source: DEED Local Area Unemployment Statistics (LAUS)
This growth puts Northwest Minnesota in a distinct position among Greater Minnesota's most rural regions. Northeast Minnesota's labor force remains 2.7% below its 2011 level, and Southwest's is 3.1% below. Both regions are losing workers faster than they can attract replacements. Northwest, by contrast, has grown its labor force 1.8% above 2011, a meaningful milestone that reflects the region's success in attracting working-age residents from elsewhere.
This in-migration story was documented in a recent blog. Northwest Minnesota's population growth since 2021 has been driven entirely by net migration: the region now experiences more deaths than births each year, meaning all population growth comes from people moving into the Northwest. From 2020 to 2024, the region gained an estimated 2,697 net migrants aged 25 to 54, the prime working years with the highest labor force participation rates. Reduced out-migration of younger adults aged 15 to 24 adds to the longer-term outlook.
Critically, when new workers enter a labor market, whether through migration or labor force re-entry, they (or their family members in the case of moving for a job) do not always find employment immediately. A period of job searching, retraining, or transition typically precedes employment. This means a growing labor force mechanically produces some unemployment even when the underlying economy is healthy.
That is precisely what the data suggest has been happening in Northwest Minnesota. Permanent layoff initial claims in first quarter 2026 were lower than in 2018, and only 1.6% higher than 2019, and that's comparing to today's larger labor force. This confirms that the rising unemployment rate is not being driven by elevated layoffs. Instead, a larger number of workers are entering a market that is taking time to absorb them. Unfortunately, the relatively smaller number of permanently laid off workers are having a tougher time getting rehired.
From 2023 to 2025, Northwest Minnesota's labor force grew 1.3% per year, faster than every other Greater Minnesota region and faster than the state's 1.1%. Central Minnesota matched this pace, but Central's growth is heavily influenced by its adjacency to the Twin Cities, and the fact that it is a central employment hub in its own rite. However, Northwest's labor force growth is more diversified, driven by domestic in-migration to a region with no single dominant labor market center, spread across two interstate metropolitan areas (Fargo-Moorhead and Grand Forks-East Grand Forks) and several micropolitan centers: Alexandria, Bemidji, Brainerd, Fergus Falls, and Wahpeton.
The labor force growth of recent years represents a structural improvement in the region's workforce supply that did not exist during the 2011-2015 recovery from the Great Recession aftermath, nor during the 2016-2019 expansion. In both of those economic expansion periods, the Northwest's labor force was flat or declining. The current period is genuinely different, and that difference is good news for the region's long-term economic capacity, even as the unemployment rate ticks up in the near term.
Job Growth Has Slowed and 2025 Brought the First Decline in Five Years
Labor force growth explains the supply side of the equation. The demand side – how many jobs employers are creating, and in which sectors – tells the rest of the story. What is the trend in employers creating jobs? Employment regained and exceeded pre-pandemic levels in 2023, marking the completion of the pandemic recession recovery. So, the years since 2023 represent the current labor demand trend.
It is characterized in contrast to the 2020-2022 period of drastic shift from recession to recovery that brought a historically tight labor market. But it is better understood in comparison to the five years before the pandemic which, like the years since 2022, were uninterrupted by recession.
Comparing the employment trend in the Northwest to statewide in the pandemic and recovery explains why Northwest's labor market was so tight. In 2020, Northwest Minnesota employment declined -5.5%, significantly less than Minnesota's -6.7% decline. Rapid employment growth from 2020 to 2023 of 5.1% in the Northwest and 5.3% for Minnesota statewide propelled both to higher employment than before the pandemic (Figure 3). For the entire before-to-after period from 2019 to 2023, Northwest employment grew 0.8% while Minnesota grew 0.2% statewide. This produced a relatively tighter labor market in the Northwest.
Figure 3: Employment in Northwest Minnesota and Minnesota Statewide, 2015-2025

Source: DEED Quarterly Census of Employment and Wages
But employment growth slowed in 2024 and 2025, even slower than before the pandemic. Northwest employment grew 0.5% from 2023 to 2025, compared to 0.9% from 2017 to 2019. Minnesota grew 1.2% from 2023 to 2025, compared to 1.7% from 2017 to 2019. So, the most recent two years had slower job growth than the two years before the pandemic, and unlike the pandemic period, Northwest is back to slower growth than statewide.
While Northwest jobs grew 1.0% in 2024, stronger than the 0.9% growth from 2017 to 2019, employment declined -0.5% in 2025. This was the first decline in five years and reveals a key driver of the Northwest's loosening labor market. Northwest Minnesota added a net 1,135 jobs from 2023 to 2025, but that headline number obscures a growing divide between sectors that are expanding and those that are contracting. Understanding which sectors are growing, and why, matters not just for workforce development strategy but also for what it tells us about the health of the broader regional economy.
Health Care Leads, but Its Dominance Carries a Caveat
Health Care & Social Assistance added 2,536 jobs in Northwest from 2023 to 2025, more than any other sector (Table 2). Leading job gains is not so impressive as expected for the largest sector in the region, but the 6.5% growth rate is, making it the second fastest-growing sector. Statewide, it was also the largest and added the most jobs by far, but incredibly, it was the fastest-growing sector at a rocketing 8.8% pace.
| Industry | Employment | 2023-2025 Change | 2024-2025 Change | ||||
|---|---|---|---|---|---|---|---|
| 2023 | 2024 | 2025 | Jobs | Percent | Jobs | Percent | |
| Total, All Industries | 225,086 | 227,320 | 226,221 | 1,135 | 0.5% | -1,099 | -0.5% |
| Health Care & Social Assistance | 39,096 | 40,686 | 41,632 | 2,536 | 6.5% | 946 | 2.3% |
| Agriculture, Forestry, Fishing & Hunting | 5,510 | 5,801 | 5,963 | 453 | 8.2% | 162 | 2.8% |
| Public Administration | 15,472 | 15,858 | 15,900 | 428 | 2.8% | 42 | 0.3% |
| Construction | 12,995 | 13,428 | 13,269 | 274 | 2.1% | -159 | -1.2% |
| Admin. Support & Waste Mgmt. Services | 3,996 | 3,934 | 4,199 | 203 | 5.1% | 265 | 6.7% |
| Arts, Entertainment, & Recreation | 3,732 | 3,755 | 3,842 | 110 | 2.9% | 87 | 2.3% |
| Educational Services | 22,436 | 22,450 | 22,496 | 60 | 0.3% | 46 | 0.2% |
| Utilities | 1,289 | 1,327 | 1,340 | 51 | 4.0% | 13 | 1.0% |
| Accommodation & Food Services | 22,247 | 22,487 | 22,297 | 50 | 0.2% | -190 | -0.8% |
| Management of Companies | 546 | 525 | 579 | 33 | 6.0% | 54 | 10.3% |
| Finance & Insurance | 5,832 | 5,836 | 5,849 | 17 | 0.3% | 13 | 0.2% |
| Mining | 215 | 233 | 225 | 10 | 4.7% | -8 | -3.4% |
| Information | 2,608 | 2,611 | 2,578 | -30 | -1.2% | -33 | -1.3% |
| Professional & Technical Services | 4,602 | 4,635 | 4,507 | -95 | -2.1% | -128 | -2.8% |
| Transportation & Warehousing | 6,064 | 6,045 | 5,947 | -117 | -1.9% | -98 | -1.6% |
| Other Services | 6,931 | 7,001 | 6,798 | -133 | -1.9% | -203 | -2.9% |
| Real Estate & Rental & Leasing | 1,564 | 1,460 | 1,430 | -134 | -8.6% | -30 | -2.1% |
| Wholesale Trade | 11,536 | 11,508 | 11,044 | -492 | -4.3% | -464 | -4.0% |
| Retail Trade | 28,159 | 28,033 | 27,557 | -602 | -2.1% | -476 | -1.7% |
| Manufacturing | 30,255 | 29,702 | 28,767 | -1,488 | -4.9% | -935 | -3.1% |
| Source: DEED Quarterly Census of Employment and Wages | |||||||
This also has implications for the entire regional economy. Health Care & Social Assistance demand is driven primarily by aging demographics and insurance coverage, rather than consumer confidence or economic cycles. The U.S. Bureau of Labor Statistics (BLS) projects Health Care & Social Assistance will be the fastest growing industry sector nationally through 2034, with growth driven primarily by the aging population, increasing the incidence of chronic conditions such as diabetes, heart disease, cancer, and dementia, as well as the need for community supports for the elderly. Northwest Minnesota's older-than-average population is a regional tailwind.
Health Care employment is therefore inexorable, but it also means the sector's continued growth tells us relatively little about broader economic momentum. It is a demographic story more than an economic story. The sectors that do track the economic cycle more closely are sending more mixed, and in some cases concerning, signals.
Agriculture, Public Administration, and Construction Are Key Contributors
Agriculture, Forestry, Fishing & Hunting was the fastest-growing sector at 8.2%, adding 453 jobs. Crop Production led with 233 jobs added (+10%), followed closely by Animal Production with 197 jobs (+9%). Public Administration added 428 jobs at a more modest 2.8% growth rate, though it remains 566 jobs or 3.4% below its 2019 level, and the deceleration from 386 jobs gained in 2024 to just 42 in 2025 warrants watching.
Construction added 274 net jobs from 2023 to 2025, leaving the region with nearly 1,900 more construction jobs than in 2019. However, the sector shed 159 jobs in 2025 after gaining 433 in 2024, a reversal that deserves attention given the Construction industry's sensitivity to inflation, interest rates and financing conditions.
Understated Job Generators
Administrative Support & Waste Management Services added just over 200 jobs from 2023 to 2025, but its 2025 performance stands out: 265 jobs added, the second most of any sector, with 6.7% growth. That growth came specifically from Janitorial, Landscaping, Exterminating & Pest Control, and Waste Management services. This is a sector worth watching as an emerging job generator in a year when overall employment declined.
Arts, Entertainment & Recreation added 110 jobs over the period, with 87 of those coming in 2025, tying it for the fourth-fastest 2025 growth. Fitness & Recreational Sports Centers was the specific industry in this sector adding most of these jobs. This sector's growth matters because it relies on discretionary spending: if consumers were broadly cutting back, this sector would likely feel it.
Manufacturing: The Most Significant Warning Sign
Manufacturing shed nearly 1,500 jobs or -4.9% from 2023 to 2025, the largest loss of any sector. The composition of those losses is telling. Transportation Equipment Manufacturing led losses, shedding 731 jobs (-18%), a category that includes significant recreational vehicle and powersports manufacturing in the region. The loss of jobs tied to recreational equipment is a potential signal of weakening discretionary consumer spending.
Fabricated Metal Product Manufacturers cut 352 jobs (-8%), Miscellaneous Manufacturing lost 199 jobs (-26%), and Plastics & Rubber Product Manufacturers shed 143 jobs (-14%). Machinery Manufacturing held up a bit better, shedding 108 jobs or -2.5%.
The one bright spot was Food Manufacturing, which added 139 jobs (+2%), consistent with the region's Agriculture employment gains, and a reminder that non-discretionary demand can support growth even when other Manufacturing subsectors struggle.
Trade and the Discretionary/Cyclical Spending Signal
Retail Trade shed 602 jobs (-2.1%) and Wholesale Trade lost 492 jobs (-4.3%) from 2023 to 2025, with the bulk of both declines concentrated in 2025. Retail is particularly sensitive to consumer spending deceleration, and both sectors contracting simultaneously in the same year reinforces the discretionary spending weakness visible in Manufacturing.
Accommodation & Food Services, a highly discretionary sector that includes hotels and restaurants, gained 240 jobs in 2024 but lost 190 in 2025, ending the period with a net gain of just 50. Professional & Technical Services gained 33 jobs in 2024 then lost 128 in 2025 for a net decline of 95. Other Services lost 203 jobs in 2025 after gaining 70 in 2024, with 60% of those losses occurring in Religious, Civic & Professional Organizations (-122 jobs), suggesting financially-strapped households and businesses may have less to give. Overall, the pattern of 2024 gains followed by 2025 reversals in these cyclically sensitive sectors is consistent with a regional economy that was softening in 2025.
The Emerging Picture
Taken together, the industry data sketch two parallel stories. The first is a demographically driven expansion in Health Care, which is durable, structurally supported, and unlikely to reverse. The second is a broad softening in goods-producing, cyclical-sensitive, and discretionary-spending-dependent sectors: Manufacturing is down sharply, Retail and Wholesale are contracting, while Construction and Food Services were reversing gains. The sectors declining in 2025 tend to be those most sensitive to consumer confidence and business investment. Whether that softening deepens into 2026 or stabilizes is the central question the labor market data will need to answer in the months ahead.
Conclusion
Northwest Minnesota's labor market in 2026 is best understood as a market in transition, between the extraordinary tightness of the pandemic recovery and whatever comes next. The labor supply picture is genuinely encouraging. A labor force at its largest total in over a decade, growing faster than the other rural regions in Greater Minnesota, reflects a structural improvement that simply didn't exist in either the post-recession recovery of 2011-2015 or the pre-pandemic expansion of 2016–2019. In-migrants settling across the region's metropolitan and micropolitan areas are expanding the workforce base, and a rising unemployment rate in this context is not a sign of economic decline.
The demand picture is more mixed. Health Care will continue to expand, carried by demographics. But the sectors that typically track the economic cycle, such as Manufacturing, Retail and Wholesale Trade, and Construction, all softened in 2025, and the pattern of gains reversing in the most recent year's data is a flag worth watching. One of the region's most distinguishing industries, Transportation Equipment Manufacturing, which includes recreational vehicles and powersports, saw particularly steep losses. While this is consistent with a pullback in consumer discretionary spending, it could also be isolated to snowmobiles and driven by singular corporate investment choices. Nonetheless, consumer discretionary spending pullbacks and waning business investment could broaden and deepen in 2026.
The central question heading into the rest of 2026 and the first half of 2027 is whether the softening stabilizes or accelerates. The labor market data in the coming months will provide a reliable signal. What the current data make clear is that Northwest Minnesota enters this period of uncertainty with a stronger workforce supply than it has had in years, and that is a solid foundation to build on.