

Population Shift and Workforce Drift in Southwest Minnesota

By Cameron Macht, Regional Analysis & Outreach Manager
Back to the Future
After gaining around 200 new residents so far this decade, Southwest Minnesota's population was closing in on 400,000 people, a total not seen since the 1980's. During the farm crisis of that decade, Southwest Minnesota lost nearly 30,000 people, dropping to a low of 390,525 people as of the 1990 Census. Since then, the region has slowly but steadily been regaining population, reaching 398,970 people in 2025 (see Figure 1).
Figure 1. Population Change, 1970-2025
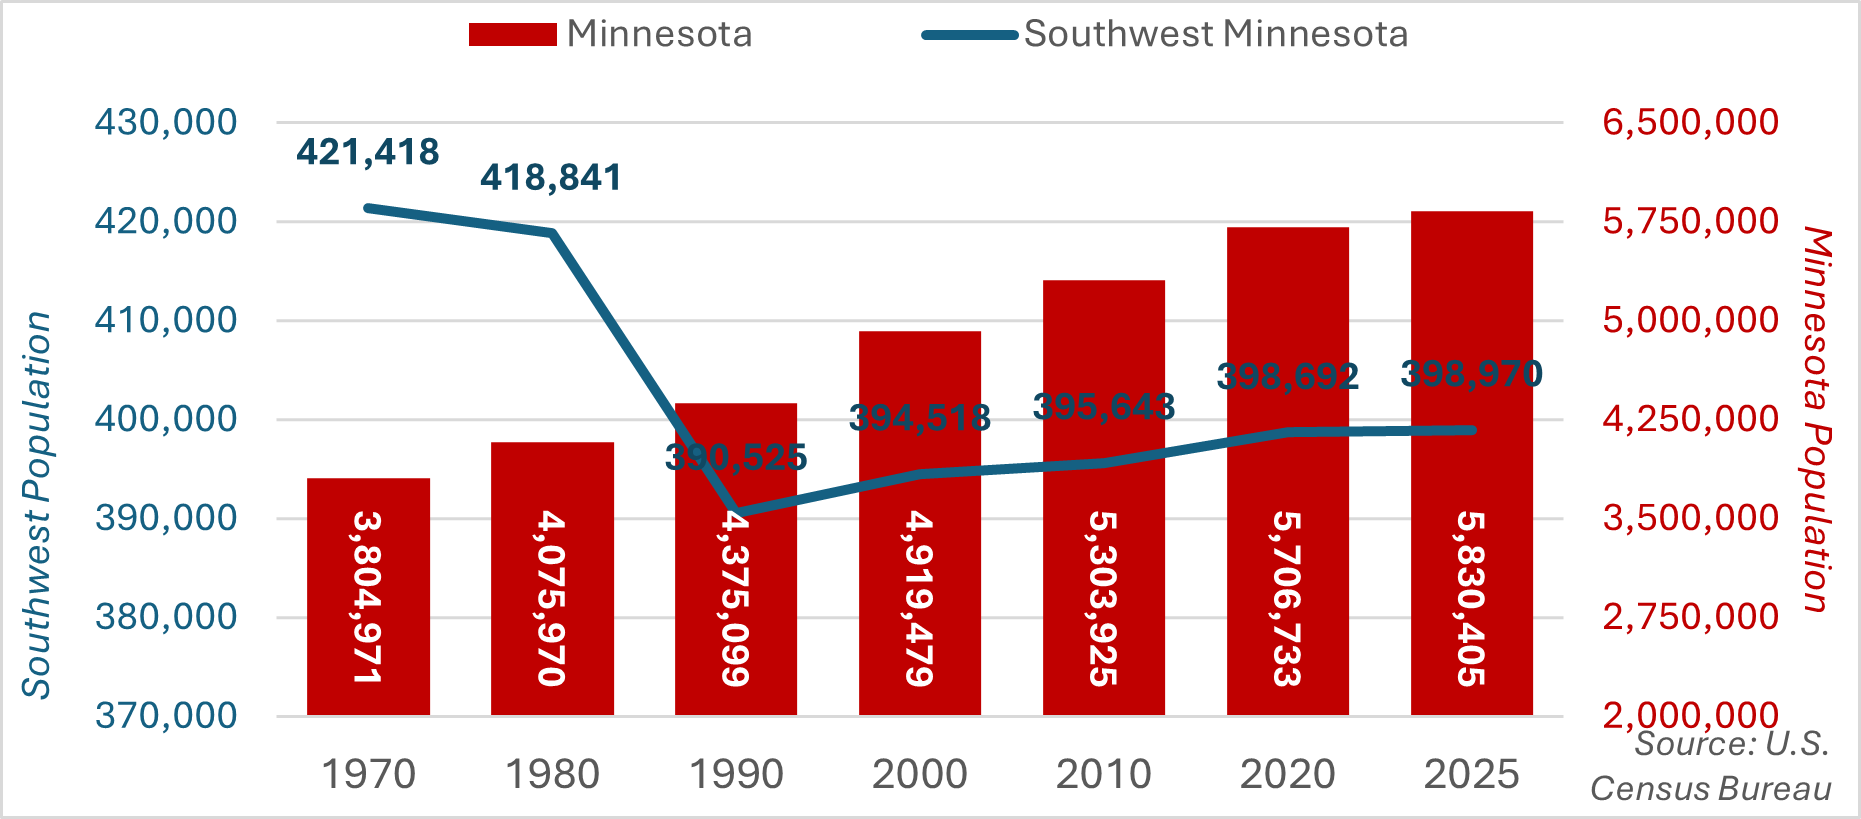
However, that growth has not been evenly distributed across the entire 23-county region. In fact, only six counties in the region saw population growth from 2020 to 2025, led by Blue Earth, Le Sueur, Sibley, Watonwan, Lyon and Nobles County. The other 17 counties lost population so far this decade, with rapid losses in Martin, Brown, Waseca, Murray and Chippewa County.
Likewise, just six counties in the region saw population growth compared to 1980. Blue Earth and Nicollet County, which comprise the Mankato-North Mankato metropolitan statistical area, combined to add more than 25,500 people over the past half century. With 70,200 people, Blue Earth is now the 13th largest county in the state and matched the state growth rate of 2.2% from 2020 to 2025. Le Sueur County added just over 6,000 residents from 1980 to 2025 and was the 23rd fastest growing county in the state this decade. Nobles, Lyon and Waseca were the other three counties in the region to grow since 1980, though they all gained less than 500 people.
With more births than deaths, Southwest Minnesota still has a positive natural rate of change, though the gap is narrowing. So far this decade, Southwest is averaging about 4,650 births per year, compared to about 4,425 deaths per year. From 2024 to 2025, the region had just 4,427 births compared to 4,192 deaths. In comparison, in the previous decade, Southwest averaged about 4,825 births per year and about 3,950 deaths per year from 2010 to 2019.
The other component of population change is net migration, which has been negative for Southwest Minnesota so far this decade. The region lost about 6,600 residents to domestic out-migration, meaning past residents moved outside the region, either to other parts of the state or to new states. But the region gained over 5,650 via international in-migration, drawing in new residents from foreign countries. Immigrants were the major source of population growth so far this decade (see Table 1).
| Total Population Change | April 1, 2020 to July 1, 2025 | ||||||
|---|---|---|---|---|---|---|---|
| Natural Increase | Vital Events | Net Migration | |||||
| Births | Deaths | Total | International | Domestic | |||
| Southwest | +159 | +1,106 | +23,213 | -22,107 | -947 | +5,664 | -6,611 |
| Minnesota | +122,685 | +63,075 | +330,813 | -267,738 | +59,610 | +96,812 | -37,202 |
| Source: U.S. Census Bureau, Population Estimates Program | |||||||
Labor Force Fluctuations
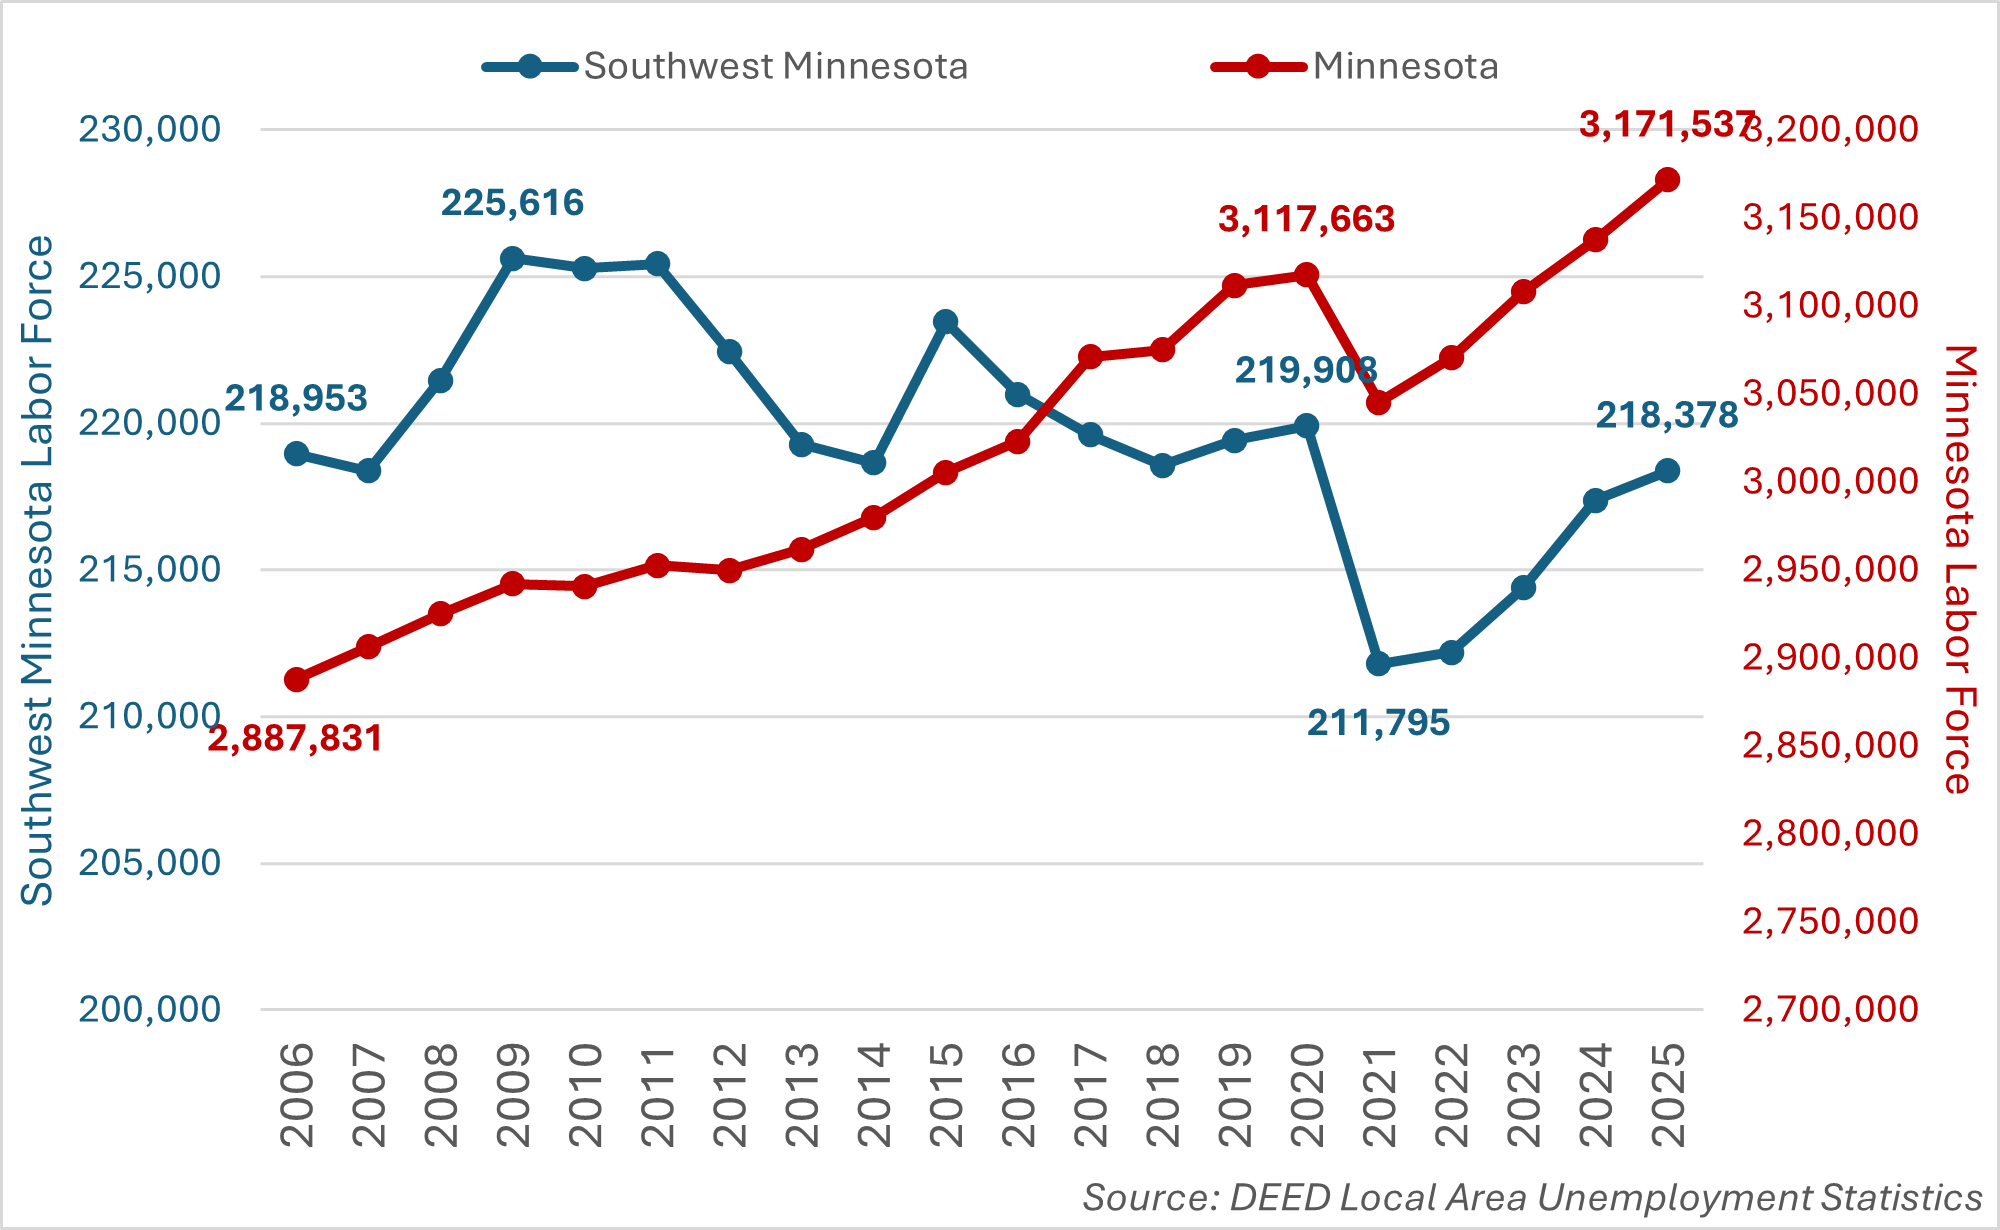
The demographics of these population trends have had both a short-term and long-term impact on the region's labor force. In 2025, the region had an average of just under 218,400 workers, which was up around 6,600 workers from the valley reached in the aftermath of the pandemic in 2021, but down more than 7,200 workers compared to the peak labor force count in 2009 (see Figure 2).
Figure 2. Annual Average Labor Force Estimates, 2006-2025
Over the past 10 years, the makeup of Southwest Minnesota's labor force has changed significantly. In 2014, 59% of the labor force was between 25 and 54 years of age, and just 5.6% was 65 years and older. By 2024, people in their prime working years accounted for 56.4% of the total labor force, while 7.8% were in the oldest age group. The number of workers from 45 to 64 years of age dropped by nearly 12,500 workers, while the number of workers aged 65 years and over increased by 4,200. The number of younger workers under 25 years also rose by about 500 people.
The biggest demographic decrease from 2014 to 2024 was workers who identified as White alone, falling from 95% of the workforce to 87.1%, a loss of around 23,100 fewer workers. In contrast, the region saw a gain of around 22,200 workers of Black or African American, American Indian, Asian, some other race, two or more races or Hispanic or Latino origin. The biggest rise was for people reporting two or more races, which gained almost 9,000 additional workers, a 555% increase. Southwest also gained around 6,000 additional workers of Hispanic or Latino origin, now accounting for over 16,000 people, or 7.7% of the total labor force. Workers of some other race also tripled from 2014 to 2024, comprising 5% of the workforce.
Changing of the Guard
In 2025, there were an average of 12,920 employer establishments providing 172,217 jobs in Southwest Minnesota, with a total payroll of just over $9.6 billion. The region lost just over 1,000 jobs over the past year, while the state saw a slight increase in jobs from 2024 to 2025. From 2020 to 2025, Southwest added 5,030 jobs, a 3.0% increase, while the state regained 235,345 jobs, an 8.7% rise (see Figure 3).
Figure 3. Industry Employment Trends, 2005-2025

Southwest Minnesota has long been known as a Manufacturing stronghold, with nearly 29,000 jobs at more than 600 Manufacturing establishments across the 23-county region. At that level, Manufacturing accounts for 16.8% of total employment in the region, compared to 10.9% statewide. With nearly $2 billion total payroll and at just under $69,000 in average annual wages, it is one of the highest paying industries in the region. However, manufacturers in the region cut 1,005 jobs over the past year and 1,200 jobs over the past five years, part of a longer-term decline. The region lost about 3,000 jobs from 2005 to 2015, then another 3,000 jobs from 2015 to 2025.
Over the same time period, Health Care & Social Assistance continued to add jobs in Southwest Minnesota. From 2005 to 2015, Health Care & Social Assistance added about 2,500 jobs, and then from 2015 to 2025, gained another 2,500 jobs, becoming the largest employing industry in the region with 32,713 jobs at 1,799 establishments. This included an increase of over 1,150 jobs in the past year, and nearly 2,700 additional jobs since 2020 (see Table 2).
| 2025 Annual Data | Avg. Annual Wage | 2024-2025 | 2020-2025 | |||||
|---|---|---|---|---|---|---|---|---|
| NAICS Industry Title | Number of Firms | Number of Jobs | Total Payroll ($1,000s) | Change in Jobs | Percent Change | Change in Jobs | Percent Change | |
| Total, All Industries | 12,920 | 172,217 | $9,638,331 | $55,952 | -1,033 | -0.6% | +5,030 | +3.0% |
| Health Care & Social Assistance | 1,799 | 32,713 | $1,849,089 | $56,524 | +1,152 | +3.7% | +2,668 | +8.9% |
| Manufacturing | 602 | 28,871 | $1,985,731 | $68,796 | -1,005 | -3.4% | -1,194 | -4.0% |
| Retail Trade | 1,436 | 19,039 | $646,397 | $33,904 | -282 | -1.5% | +593 | +3.2% |
| Educational Services | 241 | 15,817 | $854,955 | $54,288 | +128 | +0.8% | +867 | +5.8% |
| Accommodation & Food Services | 886 | 12,326 | $235,743 | $19,084 | -41 | -0.3% | +2,228 | +22.1% |
| Public Administration | 562 | 10,159 | $596,015 | $58,708 | -115 | -1.1% | +354 | +3.6% |
| Construction | 1,574 | 8,239 | $600,168 | $72,436 | -49 | -0.6% | +318 | +4.0% |
| Wholesale Trade | 644 | 7,406 | $588,387 | $79,456 | -334 | -4.3% | -129 | -1.7% |
| Transportation & Warehousing | 753 | 6,918 | $365,691 | $52,884 | -67 | -1.0% | -204 | -2.9% |
| Finance & Insurance | 705 | 5,730 | $481,478 | $84,084 | -91 | -1.6% | -477 | -7.7% |
| Agriculture, Forestry, Fishing & Hunting | 746 | 5,125 | $278,036 | $54,132 | -78 | -1.5% | -425 | -7.7% |
| Other Services | 1,081 | 4,930 | $183,928 | $37,284 | -139 | -2.7% | +469 | +10.5% |
| Professional & Technical Services | 633 | 3,988 | $309,563 | $77,584 | +91 | +2.3% | +424 | +11.9% |
| Admin. Support & Waste Mgmt. Svcs. | 419 | 3,287 | $171,011 | $51,896 | +197 | +6.4% | -246 | -7.0% |
| Arts, Entertainment, & Recreation | 237 | 2,088 | $50,246 | $24,128 | +13 | +0.6% | +378 | +22.1% |
| Information | 193 | 1,855 | $125,371 | $67,600 | -145 | -7.3% | -344 | -15.6% |
| Management of Companies | 58 | 1,330 | $140,541 | $105,664 | -68 | -4.9% | -138 | -9.4% |
| Real Estate & Rental & Leasing | 254 | 1,248 | $53,239 | $42,588 | -211 | -14.5% | -70 | -5.3% |
| Utilities | 73 | 898 | $102,507 | $114,244 | -15 | -1.6% | -37 | -4.0% |
| Mining | 26 | 246 | $20,235 | $82,420 | +25 | +11.3% | -6 | -2.4% |
| Source: DEED Quarterly Census of Employment & Wages (QCEW) program | ||||||||
In addition to Health Care & Social Assistance, only five other industries added jobs from 2024 to 2025, accounting for less than 500 net new jobs. This included about 200 new jobs in Administrative Support and Waste Management Services, 125 additional jobs in Educational Services, 90 jobs in Professional & Technical Services, 25 jobs in Mining and 13 jobs regained in Arts, Entertainment & Recreation.
In contrast, along with the large loss in Manufacturing, there were notable cuts in Wholesale Trade, Retail Trade and Real Estate, Rental & Leasing, which all eliminated more than 200 jobs. There were smaller losses in Other Services, most notably in Repair and Maintenance; Information, Public Administration and Finance & Insurance.
Looking back a little further, nine industries have more jobs in 2025 than in 2020. Notably, six of the seven largest employing industries in the region have added jobs over the past five years, with Manufacturing the only sector that saw a loss. Strangely, six of the seven smallest industries in the region lost jobs over the same time period, decreasing employment diversity in Southwest.
A Changing Landscape
Southwest Minnesota's population has inched upward again this decade, nearing 400,000 residents for the first time since the 1980s. While the region overall added people from 2020 to 2025, growth was highly uneven: only six of the 23 counties increased in population, led by Blue Earth, Le Sueur, Sibley, Watonwan, Lyon and Nobles. Most counties continued long-term declines that date back to the farm crisis, though the Mankato-North Mankato area stands out for steady gains over the past half century. Natural increase remains positive but shrinking, with births barely outpacing deaths, and population growth has recently relied more heavily on international migration, which offset significant domestic outmigration.
These demographic shifts are directly shaping the region's labor force and industry mix. The labor force has rebounded modestly since the pandemic but remains smaller than its 2009 peak, and the region's age structure continues to shift as the number of older workers rises and the prime-age workforce shrinks. At the same time, the region has seen major increases in racial and ethnic diversity among workers.
Industry trends reflect a similar reshaping: Manufacturing remains a large but declining employer, while Health Care and Social Assistance has become the region's largest and fastest-growing sector. Since 2020, nine industries have added jobs, but losses in Manufacturing, Wholesale Trade and other sectors highlight an ongoing transition that is reducing employment diversity across Southwest Minnesota.