State of Minnesota's Labor Markets: Steady On!


by Nick Dobbins and Oriane Casale
June 2025
Summary
Minnesota's labor markets were stable over the past year, with most indicators showing continued strength and a few indicating slightly slowing employer demand. While both jobs and the labor force have continued to grow over the last year, labor force participation has remained relatively steady, as has the unemployment rate. Black, Indigenous and People of Color workers are driving increases in the labor force. Although both underemployment and long-term unemployment have ticked up over the past year, the monthly JOLTS survey continues to show robust employer demand in Minnesota as does Minnesota's 2024 Job Vacancy Survey.
Employment
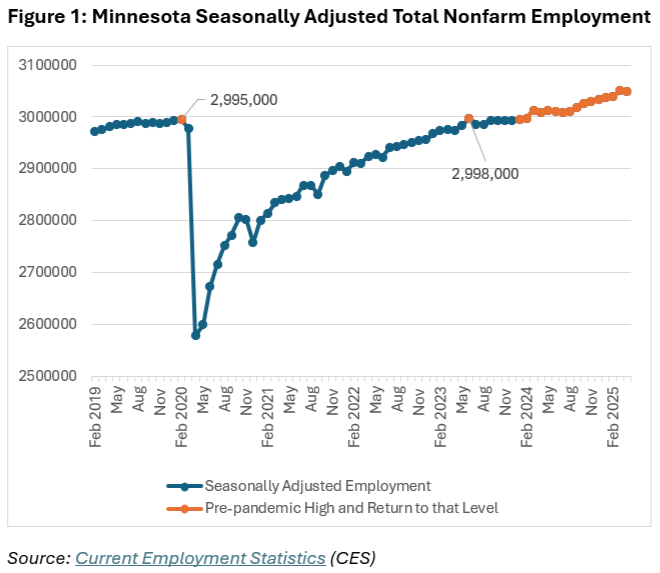
Payroll growth stabilized in recent months and appeared to find its new baseline following the post-pandemic recovery as steady growth has been the overall trend of 2024 and early 2025. As Figure 1 shows, seasonally adjusted total nonfarm employment returned to pre-pandemic levels briefly in June 2023 before dipping back below that high point for the rest of the year. In January 2024 we once again surpassed the pre-pandemic high of 2,995,000 jobs and employment has stayed above that benchmark in every month since, hitting a historical high of 3,051,300 jobs in March 2025.
Seasonally adjusted growth has not been consistent across industries during this period. Education & Health Services added 31,200 jobs, the most real growth of any supersector by a large margin, more than doubling Government's 13,200. The Health Care & Social Assistance subsector added 30,400 jobs alone. Education & Health Services also posted the largest proportional growth, up by 5.4%. While most industries in Minnesota posted growth, three of eleven supersectors lost jobs in the 16 months since January 2024. Financial Activities lost 3,200 jobs, Information lost 900 jobs and Professional & Business Services lost 600 jobs.
| Table 1: Seasonally Adjusted Minnesota Employment | ||||
|---|---|---|---|---|
| Industry | January 2024 | April 2025 | Actual Change | Percent Change |
| Total Nonfarm | 2,995,700 | 3,050,000 | 54,300 | 1.8 |
| Total Private | 2,570,600 | 2,611,700 | 41,100 | 1.6 |
| Goods-Producing | 466,000 | 471,300 | 5,300 | 1.1 |
| Mining & Logging | 6,500 | 6,700 | 200 | 3.1 |
| Mining, Logging, & Construction | 142,900 | 147,500 | 4,600 | 3.2 |
| Construction | 136,400 | 140,800 | 4,400 | 3.2 |
| Manufacturing | 323,100 | 323,800 | 700 | 0.2 |
| Service-Providing | 2,529,700 | 2,578,700 | 49,000 | 1.9 |
| Private Service Providing | 2,104,600 | 2,140,400 | 35,800 | 1.7 |
| Trade, Transportation & Utilities | 535,800 | 537,500 | 1,700 | 0.3 |
| Information | 43,900 | 43,000 | -900 | -2.1 |
| Financial Activities | 189,500 | 186,300 | -3,200 | -1.7 |
| Professional & Business Services | 375,600 | 375,000 | -600 | -0.2 |
| Education & Health Services | 575,800 | 607,000 | 31,200 | 5.4 |
| Leisure & Hospitality | 269,900 | 271,900 | 2,000 | 0.7 |
| Othe Services | 114,100 | 119,700 | 5,600 | 4.9 |
| Government | 425,100 | 438,300 | 13,200 | 3.1 |
| Source: Current Employment Statistics (CES) | ||||
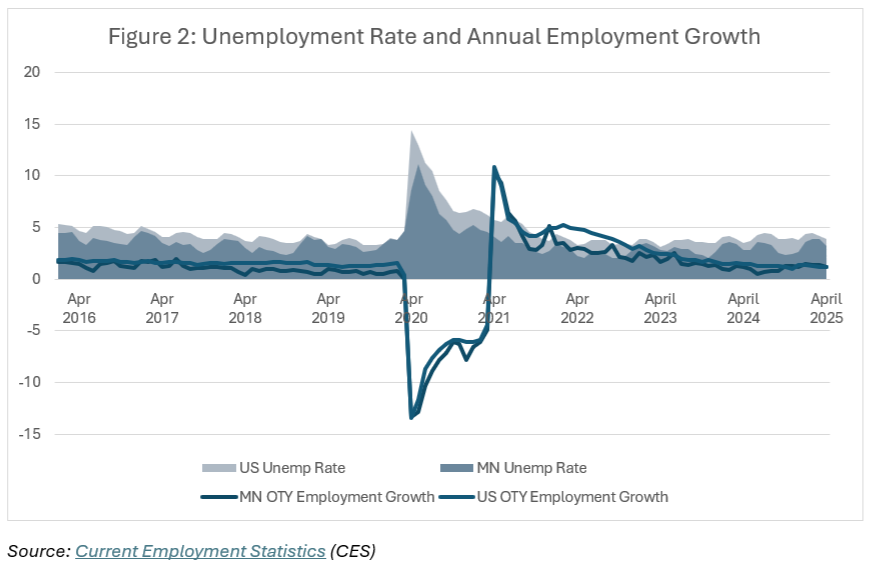
Not-seasonally adjusted annual growth has flattened in recent years as the recession and recovery gave way to stability. In 2022, average over-the-year (OTY) growth in Minnesota was 2.7%, while in 2023 it was 1.8%, in 2024 it was 1.0%, and so far in 2025 it has been 1.3%, which is in line with pre-pandemic growth. As Figure 2 shows, national annual employment growth outpaced Minnesota growth for much of the immediate post-pandemic recovery. That difference all but disappeared in recent months as state and national growth rates have moved towards each other and have been within two-tenths of a percent of each other for the first four months of 2025.
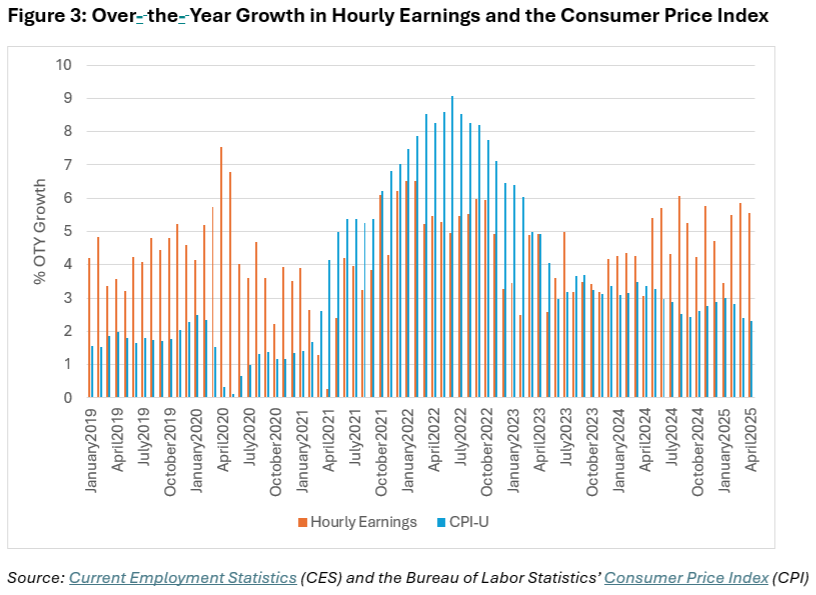
Wage growth has also leveled out in recent months following a period of instability in the post-recession years. National inflation spiked starting in 2021, causing real earnings (earnings relative to the Consumer Price Index) to decline. Real earnings began declining in early 2021 as inflation increased, hitting a low point in June 2022 before rebounding in recent years. Real hourly earnings in Minnesota have recovered from the lows of 2022 and 2023 and as Figure 3 shows, annual growth in hourly wages continues to outpace CPI growth as of April 2025.
Workforce
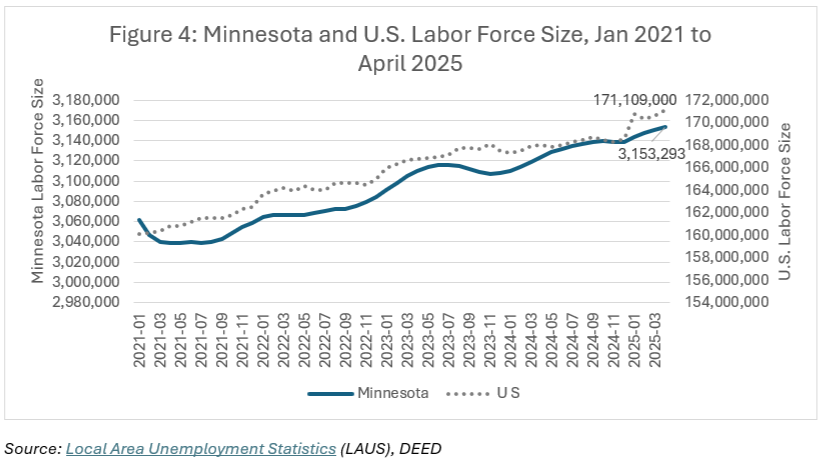
Minnesota's labor force growth picked up a bit of steam over the past 12 months, with the addition of 29,119 people, or an average of 2,427 people per month through April 2025. Growth was even a bit quicker during the first four months of 2025, averaging 3,683 additional people in the labor force each month. In comparison, over the last three years from 2021 to 2024, on average 2,321 people joined Minnesota's labor force monthly. However, Minnesota's labor force growth remains slower than national growth at 0.9% over the last 12 months compared to 1.9% nationally (see Figure 4).
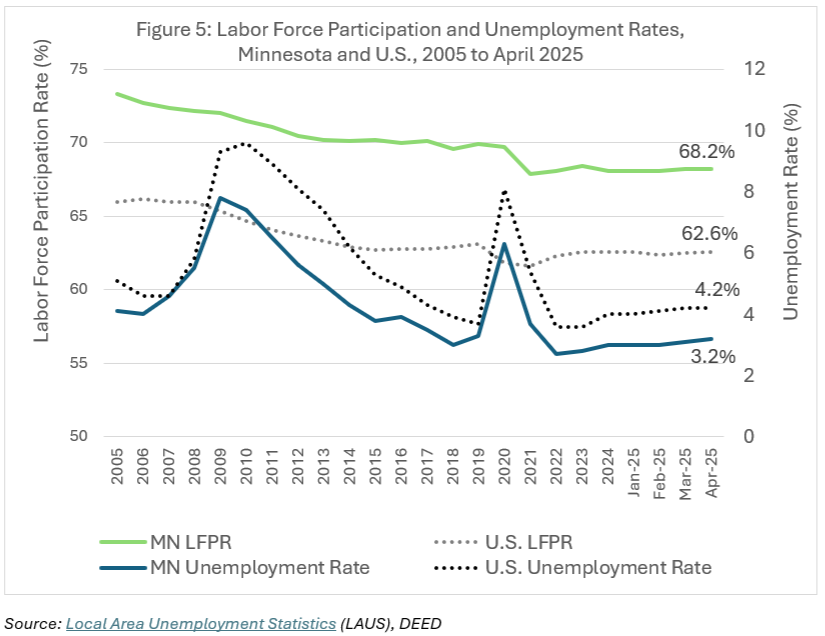
Minnesota's labor force participation rates and unemployment rates changed little over the last 12 months through April 2025. The labor force participation rate, or the share of the population age 16 years and older that is either working or looking for work, fluctuated between 68% and 68.2% over the period, landing at 68.2% in April – one of the highest rates in the nation. The unemployment rate showed the same pattern, fluctuating between 3.0% and 3.2%. The unemployment rate has ticked up in 2025 from 3.0% in January and February to 3.2% in April, but it is as yet unclear if this is an upward trend or more of the pattern we've seen over the last 12 months (see Figure 5).
Breaking the numbers out by gender shows that both labor force participation and unemployment rate trends have diverged for men and women over the past year in Minnesota. As Figure 6 below shows, unemployment rates for women have increased by more than a percentage point in the last 12 months, from 2.7% in April 2024 to 3.8% in April 2025, while unemployment rates for men have remained relatively level at 3.1% in April 2024 and 3.3% in April 2025. Simultaneously, labor force participation for women has decreased, from 65.9% in April 2024 to 64.1% in April 2025, while labor force participation for men has increased from 71.5% to 72.2% over the year.
There could be a variety of explanations for this, from difficulty finding child and elder care (women still do the majority of care taking in the U.S.) to slower hiring in traditionally female-dominated occupations, although there is little sign of this in other available statistics as of the writing of this article. It is also important to acknowledge that the survey from which these data come, the Current Population Survey, has a very small sample, surveying only about 900 households per month in Minnesota. Although these statistics each roll together 12 months of data to create a 12-month moving average, they are still less reliable than they would be if they were derived from a larger sample.
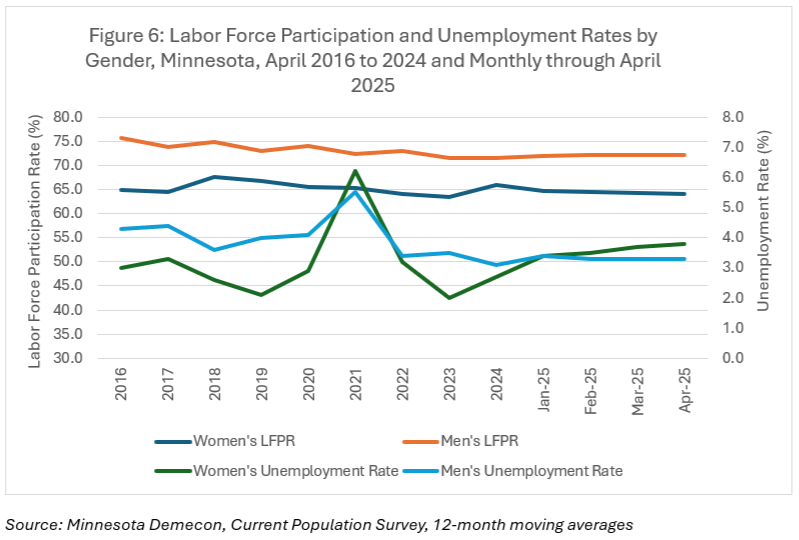
Mirroring Minnesota, U.S. labor force participation rates remained level for women over the year in April at 57.5% but ticked up 0.3 percentage points for men to 68.0% in April 2025. Unemployment rates have increased for both men and women over the year in April, ticking up 0.5 percentage points for men to 4.4%, and 0.3 percentage points for women, to 4.0%.
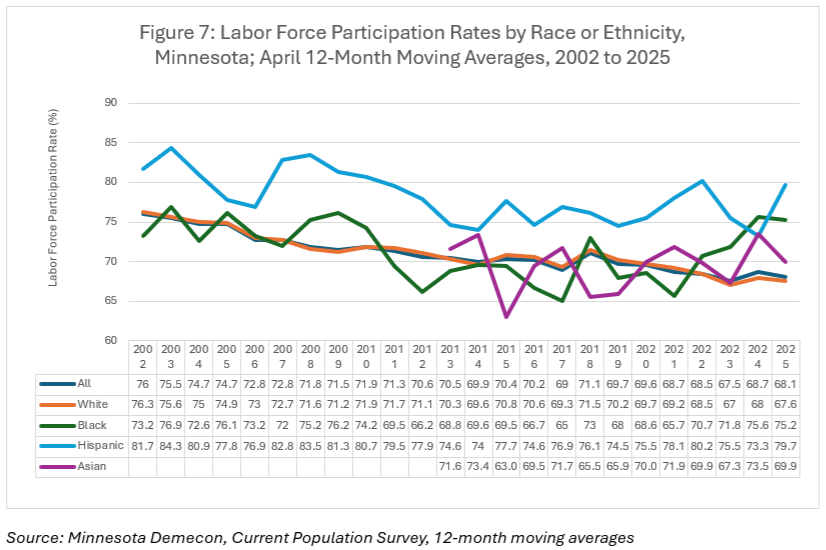
By race, labor force participation rates are down over the year in every group tracked by the Current Population Survey with the exception of Hispanic Minnesotans, who saw a 6.4 percentage point jump in labor force participation to 79.7% (see Figure 7). As has been the case since 2022, white Minnesotans have the lowest labor force participation rates of the four groups, in large part because they are, on average, by far the oldest group (see Table 2). Moreover, white labor force participation has been declining steadily since at least the beginning of this data series in 2002. This decline is pulling labor force participations rates down overall, since white Minnesotans are by far the largest group by race in the state, comprising about 85% of the civilian non-institutional population age 16 and over.
| Table 2: Median Age of the Population in Minnesota, 2023 | |
|---|---|
| Race or Ethnicity | Median Age |
| Asian | 26.7 |
| Black | 25.9 |
| Hispanic | 26.6 |
| White | 39.5 |
| Source: American Community Survey, Census Bureau, Tables B01002 | |
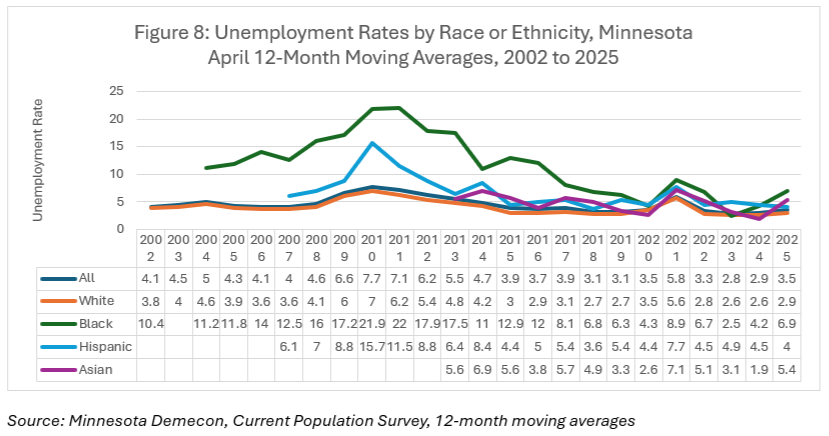
Likewise, over the year, unemployment rates have ticked up for every group except Hispanic Minnesotans, who saw a 0.5 percentage point decline to 4.0% in April 2025. Asian Minnesotans saw the greatest increase, with unemployment rates rising 3.5 percentage points to 5.4%, followed by Black Minnesotans with a 2.7 percentage point increase to 6.9% . White Minnesotans saw a small 0.3 percentage point increase, to 2.9% (see Figure 8).
Very little information is available to break down employment by age from the Current Population Survey Demecon series, but we do track teen employment, focusing on 16- to 19-year-olds (see Figure 9). Teen labor force participation fell from it's record high in 2024 at 64.9% to 54.8% in April 2025, though that is still higher than average for an April dating back to 2002.
Teen unemployment, which generally greatly exceeds unemployment for workers age 20 and over, has been low since 2022 compared to previous years. It is currently at 7.1% and had fallen to 5.5% in April 2024. Teen employment tends to be very sensitive to labor market conditions. If jobs are plentiful and easy to land, teens tend to work, but once the labor market tightens, teens struggle to land jobs more than adults because they lack experience and tend to give up more quickly.
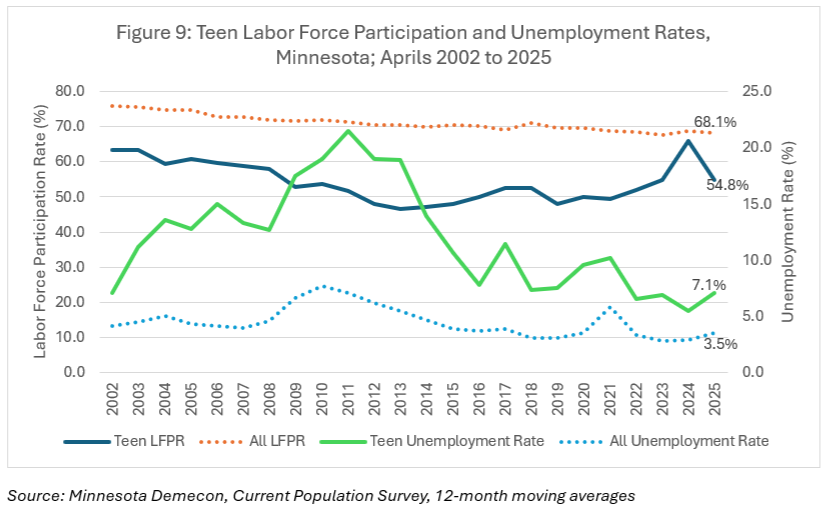
Again, it is important to acknowledge that the survey from which these data come, the U.S. Current Population Survey, conducted by the Census Bureau, has a very small sample, with only about 900 households per month in Minnesota. This is particularly true for smaller demographic groups. Moreover, these statistics do not match the official labor force or unemployment rate statistics discussed above because they roll together 12 months of data and because they are not produced using the same methodology. Finally, because they combine 12 months of data, they more accurately represent the midpoint of the estimates. Although most of the statistics listed are April 2025, they more accurately represent autumn 2024 labor market conditions.
Labor Market
While unemployment remains low, the number of people unemployed and the number of underemployed workers have been ticking up over the last three years. Figure 10 shows the share of the following categories of underemployed workers during April from 2002 to 2025:
- Officially unemployed workers who are not currently working for pay and who are actively seeking work
- Discouraged workers who want a job but are not actively seeking work because they believe that they cannot find work that fits their qualifications
- Marginally attached workers who have looked for work sometime in the past twelve months but, for reasons other than discouragement, did not look in the past four weeks
- Workers who want to work fulltime but are working part-time because they cannot find a fulltime job or because their employer has reduced their hours.
As Figure 10 shows, part-time for economic reasons is the second most common form of underemployment after the officially unemployed, with its share of total underemployed rising from 42% in 2022 to 63% in 2025. The other two categories of underemployed workers, discouraged and marginally attached, have both decreased slightly over the same time-period.
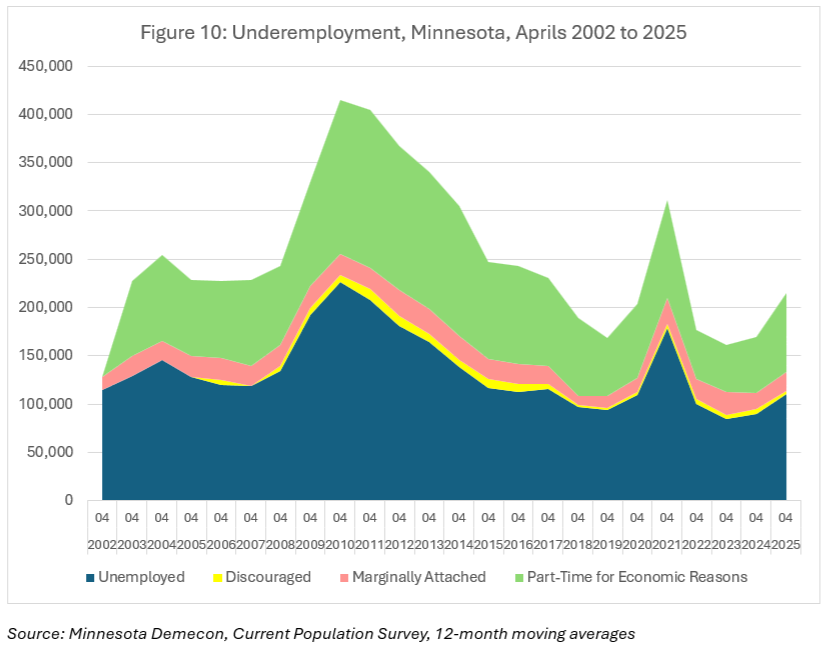
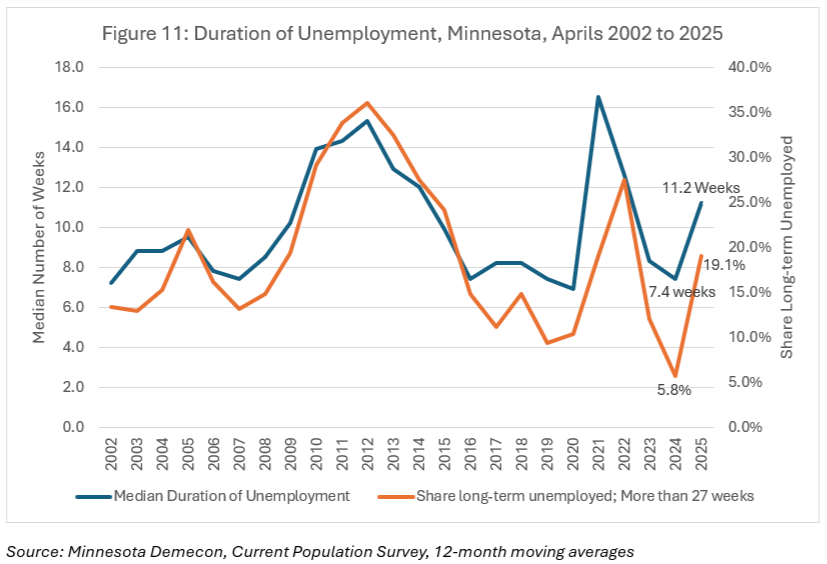
Figure 11 shows the median duration of unemployment in weeks on the left axis and the number of unemployed people who are experiencing long-term unemployment (lasting more than 27 weeks), on the right axis. As the graph illustrates, the duration of unemployment has increased to 11.2 weeks in April 2025, up from 7.4 weeks one year earlier. Long-term unemployment has increased over the same period, affecting 19% of unemployed workers in April 2025 compared to 5.8% one year earlier. Overall, unemployment duration increases when hiring slows down and/or the number of unemployed people increases.
Despite this evidence of a slowing labor market from the Current Population Survey of households, the Job Openings and Labor Turnover Survey (JOLTS) continued to show strong hiring in Minnesota in the first three months of 2025, with the numbers of both job openings and hires up over the year in March. In March 2025, there was one unemployed worker for every two job openings in Minnesota, while nationally there were an equal number of unemployed to job openings, or a ratio of 1:1.
Job Vacancies
Minnesota's 2024 Job Vacancy Survey shows continued robust employer demand with diverse opportunities for job seekers. The number of openings was down 13.4% from 2023, but was still the 11th highest on record dating back to 2001. Minnesota's Job Vacancy Survey, unlike the national JOLTS survey, provides details on job vacancies by industry, occupation and region, and provides other information including median wage offers and educational, experience and certification/licensure requirements.
Regionally, 56.3% of openings were in the seven-county Twin Cities metro area, while the remaining 43.7% were in Greater Minnesota in 2024. Compared to one year ago, the number of job vacancies decreased by 15.2% in the Twin Cities and 11.0% in Greater Minnesota.
By industry, Health Care & Social Assistance had the most job vacancies with 31,700, followed by Accommodation & Food Services with 17,700, Retail Trade with 17,600, Educational Services with 8,700 and Manufacturing with 7,700 vacancies. Combined, those five industries accounted for just over two-thirds of the total openings in the state.
Four industries had job vacancy rates that were higher than the state's rate (4.3%): Accommodations & Food Services had the highest vacancy rate of any industry at 7.8%, followed by Arts, Entertainment & Recreation at 7.2% and Retail Trade and Health Care & Social Assistance, which were both at 6.2%.
By occupational group, Food Preparation & Serving had the most job vacancies with 18,700 postings and a vacancy rate of 7.8%, followed by Sales & Related with 14,500 vacancies and a vacancy rate of 5.9%, Healthcare Practitioners & Technical with 13,700 openings and a vacancy rate of 7.3%, Healthcare Support with 9,950 openings and a vacancy rate of 5.6% and Transportation & Material Moving with 7,100 openings and a vacancy rate of 3.1%.
Five occupational groups saw small increases compared to 2023: Sales & Related; Transportation & Material Moving; Management, Office & Administrative Support; and Computer & Mathematical. The number of openings for Internships also saw a small increase over the year. All other groups saw losses compared to 2023, with the largest decline in Personal Care & Service occupations.
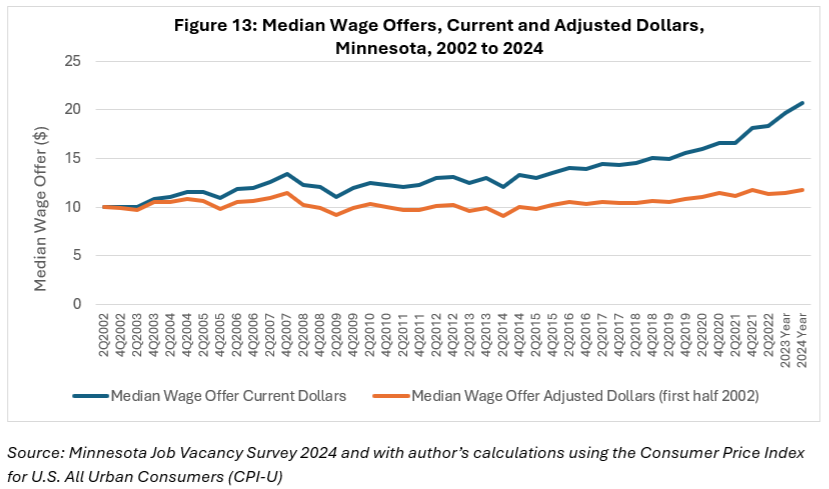
The median wage offer for all job vacancies in 2024 was $20.67 per hour, an increase of one dollar over the year and the highest on record dating back to 2001. Full-time jobs, or 72% of 2024 vacancies, had a median wage offer of $23.03 while part-time openings had a median offer of $16.62. As Figure 12 shows, wage offers by education ranged from $16.65 per hour for vacancies with no educational requirement to almost $50 per hour for vacancies requiring an advanced degree. Vacancies with post-secondary education requirements offered a large bump up in median wage offer from those requiring no education: those requiring vocational training offered $25.19, those with an associate's degree requirement offered $30.06 and those with a bachelor's degree requirement offered $34.44 for a median hourly wage offer. However, vacancies with post-secondary requirements represent only 36% of all openings.
Employers also greatly value experience. Vacancies that require less than one year of experience offered a median wage of $17.73 per hour, while those requiring four or more years of related experience offered a median wage of $44.07. Employers are often willing to substitute experience for education or vice versa depending on the occupation.
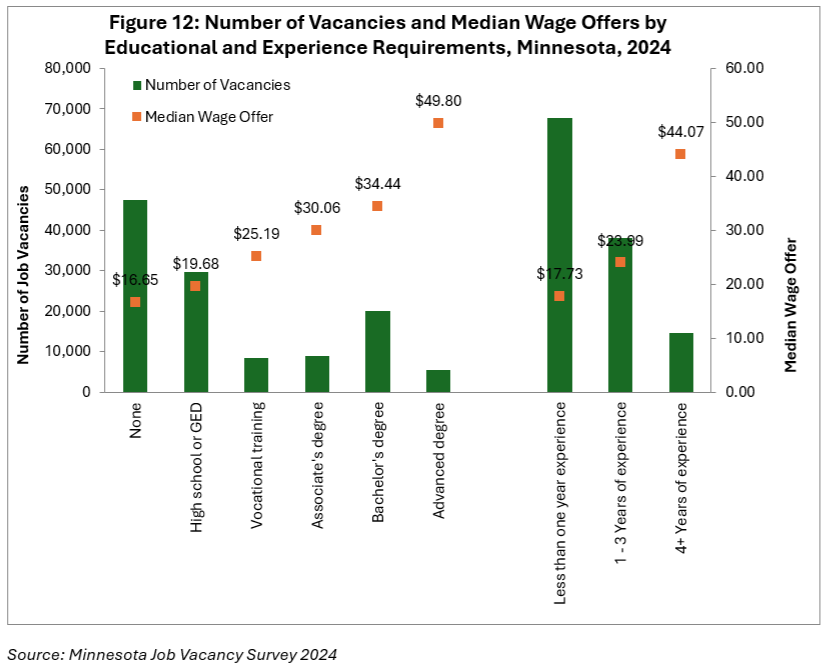
Figure 13 shows median wage offers from 2002 to 2024 in both current and inflation-adjusted dollars. Even with higher inflation, adjusted wage offers (or real wage offers) started to tick up in 2019 and have continued that trend. The median inflation adjusted wage offer was $11.73 in 2024, $11.47 in 2023 and $11.37 in 2022. Median wage offers during the Pandemic Recession were outliers, coming in as high as $11.74 during fourth quarter 2021. But prior to the start of the Pandemic Recession, median wage offers had never risen above $10.91, and that was in second quarter 2007.
Conclusion
Overall, Minnesota's labor market was stable over the past year, with most indicators showing continued strength and a few indicating slightly slowing employer demand, particularly in the first four months of 2025. Both jobs and the labor force continued to grow at a steady pace, while labor force participation remained relatively steady, as did the unemployment rate. Digging deeper into the data, it is clear that Minnesota's Black, Indigenous and People of Color workforce is driving increases in the labor force, with the labor force participation rate of white Minnesotans continuing to decline.
On the other hand, both underemployment and long-term unemployment have ticked up over the past year. This, in combination with the over-the-year decline in national GDP, could signal a slowing economy in the coming year. However, the monthly JOLTS survey continues to show strong employer demand in Minnesota with very high levels of job openings and a ratio of one unemployed job seeker for every two openings, continuing to indicate a very tight labor market.
Minnesota's 2024 Job Vacancy Survey shows continued robust employer demand with a diversity of opportunities for job seekers. Although the number of openings is down 13.4% from 2023, this is still the 11th highest on record dating back to 2001. Overall, even with slowing growth, Minnesota's labor market remains robust with a steady demand for workers.


