Industry Snapshots
by Cameron Macht
November 2019
NAICS 622 Hospitals
One of the most critical industries in the state is Hospitals (NAICS 622), with 131,074 jobs at 311 establishments. As such, it is the fifth largest employing industry subsector in the state, behind only Educational Services, Food Services and Drinking Places, Professional and Technical Services, and Ambulatory Health Care Services. But with an average of just over 420 employees per site, hospitals are far and away the largest employers in that regard – nearly three times the size of the next largest industry subsector, Air Transportation, which has 147.7 per site.
Hospitals account for just over one-quarter of total employment in the Health Care and Social Assistance industry, which surpassed 500,000 jobs in the second quarter of 2019. Eighty percent of these hospitals and over 95 percent of employment are at general medical and surgical hospitals, with the remainder spread evenly across psychiatric and substance abuse hospitals and other specialty hospitals that focus on a specific type of disease or medical condition, such as children's or cancer care hospitals. With a total quarterly payroll of more than $2.1 billion, hospitals provide much higher than average annual wages of $66,560 (see Table 1).
| Table 1. Minnesota Industry Employment Statistics, Qtr. 2 2019 | |||||
|---|---|---|---|---|---|
| NAICS Code | NAICS Industry Title | Number of Firms | Number of Jobs | Quarterly Payroll | Average Annual Wage |
| 0 | Total, All Industries | 181,857 | 2,918,102 | $41,757,264,288 | $57,200 |
| 62 | Health Care and Social Assistance | 18,554 | 500,373 | $6,526,257,365 | $52,156 |
| 622 | Hospitals | 311 | 131,074 | $2,181,573,143 | $66,560 |
| 622 | Total Government | 52 | 16,051 | $277,406,504 | $69,108 |
| 622 | Private | 259 | 115,022 | $1,904,166,639 | $66,196 |
| 6221 | General Medical and Surgical Hospitals | 248 | 125,593 | $2,091,368,567 | $66,560 |
| 6221 | Total Government | 35 | 13,344 | $237,275,599 | $71,084 |
| 6221 | Private | 213 | 112,249 | $1,854,092,968 | $66,040 |
| 6222 | Psychiatric and Substance Abuse Hospitals | 27 | 3,016 | $43,466,994 | $57,616 |
| 6222 | Total Government | 17 | 2,707 | $40,130,905 | $59,280 |
| 6222 | Private | 10 | 309 | $3,336,089 | $43,160 |
| 6223 | Specialty (exc. Psych. and Substance Abuse) Hospitals | 36 | 2,464 | $46,737,582 | $75,868 |
| Source: Quarterly Census of Employment and Wages (QCEW) program | |||||
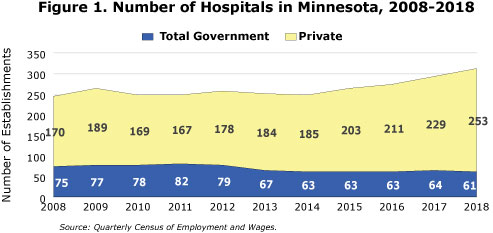
Hospitals have added 16,580 net new jobs over the past decade, a 14.5 percent increase. The number of hospitals in Minnesota has been increasing rapidly over the past decade. The state has gained 68 new hospitals since 2008, a 28 percent increase. The vast majority of hospitals are privately-owned, and the number and percentage of privately-owned hospitals has increased over the past decade, while the number of government-owned hospitals has been declining, often through mergers and acquisitions (see Figure 1).

Hospitals are expected to continue growing in the state over the next 10 years according to DEED's Employment Projections data tool. In sum, hospitals are projected to add about 10,500 jobs through 2026. Continuing recent trends, the state's private-sector hospitals are expected to add more than 11,300 jobs, while local government-owned hospitals are projected to lose 900 jobs.
NAICS 524 Insurance Carriers and Related Activities
Nearly 61,000 people are employed in Insurance Carriers and Related Activities (NAICS 524) in Minnesota, making it the 14th largest industry subsector in the state. This includes insurance carriers who provide direct life, health, and medical, direct property and casualty, and reinsurance, as well as insurance agencies and brokerages, claims adjusting, and third party administration of insurance and pension funds.
In general, insurance carriers are large businesses with an average of more than 60 employees per site, while insurance agencies and brokerages are small businesses, local independent insurance agents, with an average of less than 5 employees per site. Interestingly, insurance carriers added jobs rapidly over the past year, but are still down compared to five years ago. Agencies, brokerages, and other insurance activities cut jobs since 2018, but have seen significant growth over the past five years (see Table 1).
| Table 1. Minnesota Industry Employment Statistics | |||||||
|---|---|---|---|---|---|---|---|
| NAICS Code | NAICS Industry Title | Qtr. 2 2019 Data | Q2 2018 - Q2 2019 | Q2 2014 - Q2 2019 | |||
| Number of Firms | Number of Jobs | Numeric Change | Percent Change | Numeric Change | Percent Change | ||
| 0 | Total, All Industries | 181,857 | 2,918,102 | 24,234 | 0.8% | 172,103 | 6.3% |
| 52 | Finance and Insurance | 9,705 | 148,332 | 4,559 | 3.2% | 11,905 | 8.7% |
| 524 | Insurance Carriers and Related Activities | 4,348 | 60,930 | 2,563 | 4.4% | -336 | -0.5% |
| 5241 | Insurance Carriers | 640 | 38,577 | 2,731 | 7.6% | -2,001 | -4.9% |
| 52411 | Direct Life, Health, and Medical Insurance Carriers | 287 | 28,590 | 2,935 | 11.4% | -1,137 | -3.8% |
| 52412 | Direct Insurance (ex. Life, Health, and Medical) Carriers | 321 | 9,510 | -196 | -2.0% | -967 | -9.2% |
| 52413 | Reinsurance Carriers | 32 | 476 | -8 | -1.7% | 103 | 27.6% |
| 5242 | Agencies, Brokerages, and Other Insurance Activities | 3,708 | 22,352 | -169 | -0.8% | 1,664 | 8.0% |
| 52421 | Insurance Agencies and Brokerages | 3,226 | 15,911 | 21 | 0.1% | 885 | 5.9% |
| 52429 | Other Insurance Related Activities | 482 | 6,441 | -189 | -2.9% | 780 | 13.8% |
| Source: DEED Quarterly Census of Employment and Wages program | |||||||
Most insurance-related occupations are office jobs, and they provide relatively high wages with relatively low educational requirements. For example, according to 2019 estimates insurance sales agents earn a median wage of nearly $30 an hour without any college requirements, with a range from $16.59 per hour at the entry level to just over $65 an hour at the top end. Only three of the top 10 occupations in demand require a bachelor's degree, while the other seven can at least be started with a high school diploma, but may require licensure, industry certifications, or on-the-job training (see Table 2).
| Table 2. Top 10 Occupations in Demand in the Insurance Carriers and Related Activities Industry Subsector in Minnesota | |||
|---|---|---|---|
| Occupation | Statewide Employment | Median Wage | Typical Education Requirement |
| Insurance sales agents | 7,120 | $29.76 | High school diploma |
| Customer service representatives | 58,710 | $18.55 | High school diploma |
| Insurance claims and policy processing clerks | 6,230 | $21.65 | High school diploma |
| Claims adjusters, examiners, and investigators | 5,570 | $30.65 | High school diploma |
| Insurance underwriters | 1,620 | $31.27 | Bachelor's degree |
| Office clerks, general | 55,140 | $17.90 | High school diploma |
| First-line supervisors of office and administrative support workers | 22,140 | $28.97 | High school diploma |
| General and operations managers | 46,440 | $45.84 | Bachelor's degree |
| Secretaries and administrative assistants | 31,920 | $19.72 | High school diploma |
| Management analysts | 14,990 | $38.43 | Bachelor's degree |
| Source: BLS Industry-Occupation Matrix, DEED Career and Education Explorer | |||
NAICS 518 Internet Services Providers, Web Search Portals, and Data Processing Services
With "big data" becoming a bigger deal, Minnesota is well positioned to capitalize on the use of data processing, web hosting, and related services. The official definition of the industry subsector (NAICS 518) includes "establishments primarily engaged in providing infrastructure for hosting or data processing services. These establishments may provide specialized hosting activities, such as web hosting, streaming services, or application hosting (except software publishing), or they may provide general time-share mainframe facilities to clients. Data processing establishments provide complete processing and specialized reports from data supplied by clients or provide automated data processing and data entry services.1"
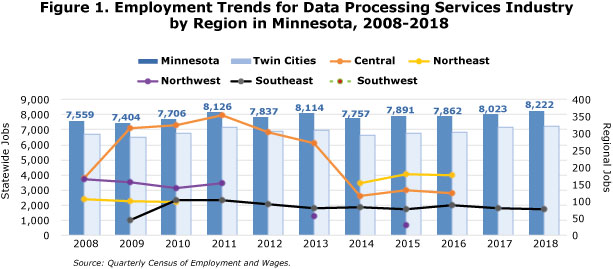
Minnesota was home to 570 of these establishments in 2018, providing an average of 8,222 jobs. Despite the relatively small number of jobs in the industry, total payroll came close to $855 million in 2018. That meant average annual wages were nearly $105,000 per job, making it one of the highest paying industry subsectors in the state. Along with rising wages, data processing services also gained 663 net new jobs over the past 10 years, an 8.8 percent expansion. The growth during the recovery has been uneven, however, with employers surpassing 8,000 jobs in 2011, 2013, and 2017, then suffering job cuts in 2012 and 2014 (see Figure 1).

Almost 90 percent of the data processing, hosting, and related services jobs in the state are located in the seven county Twin Cities metro area, with much smaller concentrations popping up in the Central, Northeast, and Southeast regions of the state. The Twin Cities accounted for 84 percent of the job gains from 2008 to 2018, while Central had as many as 355 jobs in 2011, but since has dropped below 125 jobs. Northeast surpassed 175 jobs in 2016, Southeast has hovered between 80 and 100 jobs since 2010, and Northwest saw major declines over the course of the decade.
The largest occupations in the industry include software developers and programmers, computer support specialists, computer and information analysts, and database and systems administrators and network architects, all of which require postsecondary training. But as noted above, the higher education leads to higher wages, with many of those jobs offering median wages over $40 per hour.
1518210 – Data Processing, Hosting and Related Services. U.S. Census Bureau.
NAICS 924 Justice, Public Order, and Safety Activities
There are nearly 24,000 jobs in the state dedicated to protecting and serving the citizens of Minnesota in Justice, Public Order, and Safety activities (NAICS 922). All of these jobs are in the public sector, with over 90 percent at the state and local government level and just 9 percent working for the federal government (see Table 1).
| Table 1. Minnesota Industry Employment Statistics, Qtr. 2 2019 | ||||||
|---|---|---|---|---|---|---|
| NAICS Code | NAICS Industry Title | Number of Jobs | Federal Share | State Share | Local Share | Average Annual Wage |
| 9221 | Justice, Public Order, and Safety Activities | 23,900 | 9.2% | 41.1% | 49.7% | $68,432 |
| 92211 | Courts | 5,064 | 7.5% | 58.7% | 33.8% | $65,312 |
| 92212 | Police Protection | 6,303 | 10.9% | 3.7% | 85.4% | $76,960 |
| 92213 | Legal Counsel and Prosecution | 2,673 | 5.5% | 40.2% | 54.3% | $79,872 |
| 92214 | Correctional Institutions | 6,693 | 13.8% | 65.1% | 21.1% | $58,916 |
| 92215 | Parole Offices and Probation Offices | 152 | 0.0% | 0.0% | 100.0% | $63,856 |
| 92216 | Fire Protection | 1,511 | 0.0% | 3.9% | 96.1% | $62,140 |
| 92219 | Other Justice, Public Order and Safety Activities | 1,503 | 3.3% | 75.4% | 21.2% | $71,864 |
| Source: DEED Quarterly Census of Employment and Wages | ||||||
There were 117 correctional institutions in the state, including jails, prisons, and other detention centers, providing nearly 6,700 jobs in the second quarter of 2019. The state provides about two-thirds of those jobs, while local jails account for 21 percent, and federal prisons cover 14 percent. This subsector actually had the lowest average annual wages in the industry at $58,916.
More than 6,300 people work in police protection, with more than 85 percent in local government police departments and sheriff's offices. Minnesota also has more than 5,000 jobs in the court system, with one third at the local level, about 60 percent at the state level, and 7.5 percent at the federal level. The highest earning subsector was legal counsel and prosecution, which includes attorney generals, public defenders, district attorneys, and public prosecutors offices.
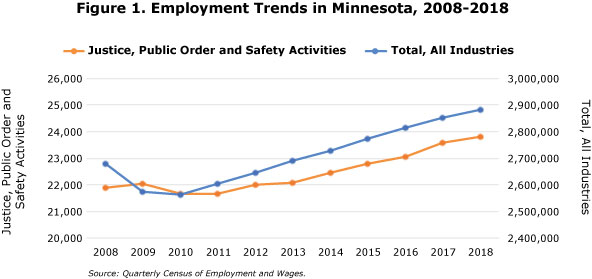
Justice, Public Order, and Safety activities added about 1,900 jobs over the past decade, an 8.7 percent increase. That was slightly faster than Minnesota's economy grew, following a 7.5 percent rise from 2008 to 2018 (see Figure 1). After adding 762 jobs, police protection saw the largest job gains in the past 10 years, followed by legal counsel and prosecution, which gained 419 jobs, courts, which added 361 jobs, and correctional institutions, which bumped up by 227 jobs. In contrast, only Other Justice, Public Order, and Safety activities lost jobs since 2008.
In a society that values Justice, Public Order, and Safety Activities, these jobs appear to be safe in the long-term as well. Local and state government employment is projected to increase about 5 percent in the next decade.


