View: Home | Data Tool | About | Findings | Methodology | LMI Help
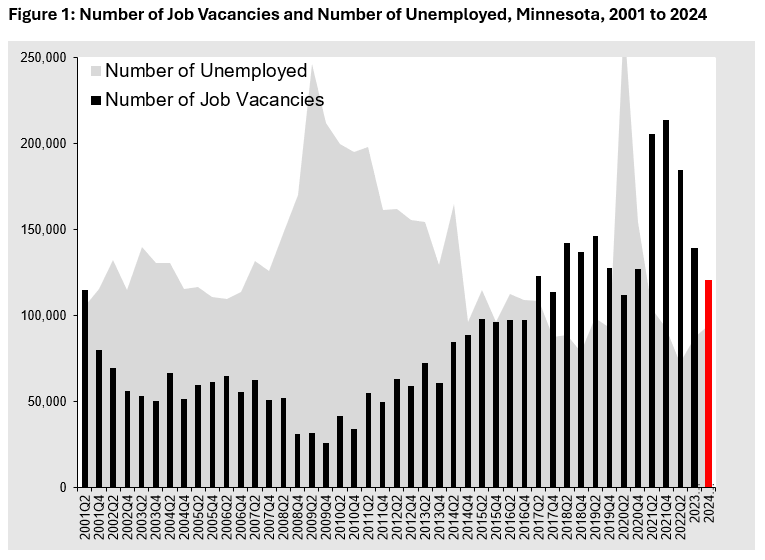
During 2024, employers in Minnesota reported a total of 120,448 vacancies, down 13.4% from 2023 (see Figure 1). This is the 11th highest number of vacancies on record in Minnesota going back to 2001. However, it is well down from the previous three years when the economy and labor markets in Minnesota and the nation were bouncing back from the Pandemic Recession.

The 2023 Job Vacancy Survey rolled out a new methodology that divides the sample and data collection across two rounds, second and fourth quarters of the year. The advantages of this methodology are that the time series going back to 2001 is maintained while the annual sample size, and thus the annual data collection and processing effort, is shrunk in half. 2024 continues this methodology with the analysis comparing year of 2024 to year of 2023 estimates.
In 2024, the number of vacancies declined and the number of unemployed individuals increased compared to 2023. With 94,300 unemployed workers statewide in 2024, there were 0.8 unemployed persons for each vacancy, or 8 unemployed individuals for every 10 open positions in Minnesota. This is up from 0.6 in 2023. This indicates that the labor market was more balanced in 2024 than it has been recently, with a closer to 1:1 ratio between the number of unemployed individuals and the number of job vacancies than we had between 2021 and 2023.
These 120,448 total vacancies translate into a job vacancy rate of 4.3%, or 4.3 job openings for every 100 filled jobs in the state. This rate is down from 5.1% in 2023, and a peak above 8.0% in 2021 (see Table 1).
| Year/Quarter | Number of Job Vacancies | Number of Vacancies per 100 Jobs | Number of Unemployed Workers | Number of Unemployed per Vacancy |
|---|---|---|---|---|
| 2024 Year | 120,448 | 4.3% | 94,296 | 0.8 |
| 2023 Year | 139,059 | 5.1% | 87,215 | 0.6 |
| 2nd Quarter 2022 | 184,588 | 6.9% | 72,526 | 0.4 |
| 4th Quarter 2021 | 214,071 | 8.2% | 92,924 | 0.4 |
| 2nd Quarter 2021 | 205,714 | 8.0% | 123,617 | 0.6 |
| 4th Quarter 2020 | 127,314 | 4.5% | 139,978 | 1.1 |
| 2nd Quarter 2020 | 111,753 | 4.0% | 299,579 | 2.7 |
| 4th Quarter 2019 | 127,550 | 4.6% | 92,692 | 0.7 |
| 2nd Quarter 2019 | 146,513 | 5.3% | 93,037 | 0.6 |
| 4th Quarter 2018 | 136,917 | 4.9% | 78,905 | 0.6 |
| 2nd Quarter 2018 | 142,282 | 5.2% | 88,517 | 0.6 |
| 4th Quarter 2017 | 113,774 | 4.2% | 87,578 | 0.8 |
| 2nd Quarter 2017 | 122,929 | 4.5% | 108,623 | 0.9 |
| 4th Quarter 2016 | 97,374 | 3.6% | 109,090 | 1.1 |
| 2nd Quarter 2016 | 97,580 | 3.6% | 112,725 | 1.2 |
| 4th Quarter 2015 | 96,114 | 3.6% | 96,263 | 1.0 |
| 2nd Quarter 2015 | 97,997 | 3.7% | 114,619 | 1.2 |
| 4th Quarter 2014 | 88,927 | 3.4% | 96,358 | 1.1 |
| 2nd Quarter 2014 | 84,696 | 3.3% | 165,184 | 2.0 |
| 4th Quarter 2013 | 60,397 | 2.3% | 129,253 | 2.1 |
| 2nd Quarter 2013 | 72,569 | 2.8% | 154,701 | 2.1 |
| 4th Quarter 2012 | 58,864 | 2.3% | 155,506 | 2.6 |
| 2nd Quarter 2012 | 62,949 | 2.5% | 162,050 | 2.6 |
| 4th Quarter 2011 | 49,890 | 2.0% | 161,292 | 3.2 |
| 2nd Quarter 2011 | 54,670 | 2.2% | 198,202 | 3.6 |
| 4th Quarter 2010 | 33,804 | 1.4% | 194,897 | 5.8 |
| 2nd Quarter 2010 | 41,397 | 1.6% | 200,037 | 4.8 |
| 4th Quarter 2009 | 25,885 | 1.0% | 212,282 | 8.2 |
| 2nd Quarter 2009 | 31,358 | 1.2% | 246,687 | 7.9 |
| 4th Quarter 2008 | 31,066 | 1.2% | 170,252 | 5.5 |
| 2nd Quarter 2008 | 51,722 | 2.0% | 147,511 | 2.9 |
| 4th Quarter 2007 | 50,594 | 1.9% | 125,999 | 2.5 |
| 2nd Quarter 2007 | 62,569 | 2.4% | 131,891 | 2.1 |
| 4th Quarter 2006 | 55,736 | 2.1% | 113,744 | 2.0 |
| 2nd Quarter 2006 | 64,958 | 2.5% | 109,667 | 1.7 |
| 4th Quarter 2005 | 61,554 | 2.4% | 110,911 | 1.8 |
| 2nd Quarter 2005 | 59,513 | 2.3% | 116,510 | 2.0 |
| 4th Quarter 2004 | 51,137 | 2.0% | 115,407 | 2.3 |
| 2nd Quarter 2004 | 66,543 | 2.6% | 130,301 | 2.0 |
| 4th Quarter 2003 | 50,439 | 2.0% | 130,390 | 2.6 |
| 2nd Quarter 2003 | 53,246 | 2.1% | 140,103 | 2.6 |
| 4th Quarter 2002 | 56,166 | 2.2% | 114,581 | 2.0 |
| 2nd Quarter 2002 | 69,715 | 2.8% | 132,274 | 1.9 |
| 4th Quarter 2001 | 79,793 | 3.1% | 115,216 | 1.4 |
| 2nd Quarter 2001 | 115,072 | 4.5% | 105,326 | 0.9 |
Regionally, 66,411 job vacancies, or 56.3% of the statewide total, were located in the seven-county Twin Cities metro area, while the remaining 54,037 vacancies, or 43.7%, were located in Greater Minnesota in 2024. Compared to one year ago, the number of job vacancies decreased by 15.2% in the Twin Cities and 11.0% in Greater Minnesota.
As in past years, the job vacancy rate was higher in Greater Minnesota (5.1%) than in the Twin Cities (3.8%), with both regions exhibiting more balanced labor markets in 2024 than in 2023. The Twin Cities had a ratio of 0.7 unemployed persons to every one job vacancy, while Greater Minnesota had a slightly higher ratio at 0.8 unemployed persons to every one job vacancy.
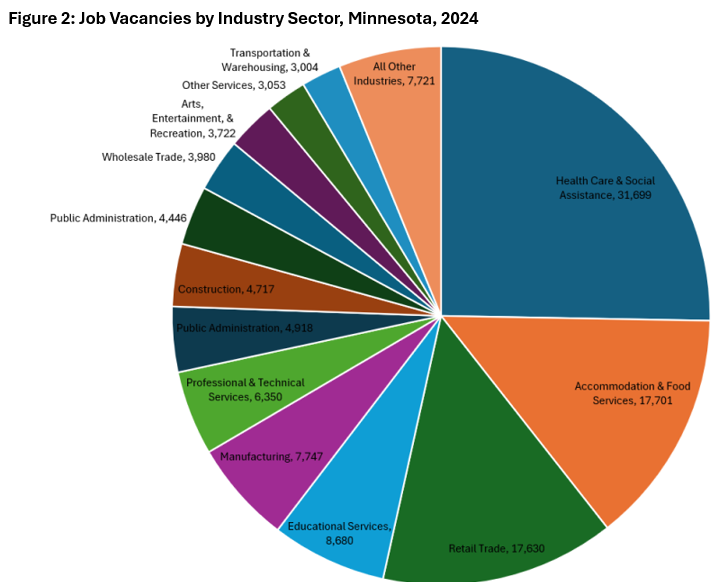
Statewide, the Health Care & Social Assistance industry had the most job vacancies with 31,700 vacancies, followed by Accommodation & Food Services with 17,700, Retail Trade with 17,600, Educational Services with 8,700 and Manufacturing with 7,700 vacancies. Combined, those five industries accounted for just over two-thirds of the total openings in the state (see Figure 2).
Four industries had a job vacancy rate that was higher than the state’s (4.3%): Accommodations & Food Services had the highest vacancy rate of any industry at 7.8% followed by Arts, Entertainment & Recreation at 7.2% and Retail Trade and Health Care & Social Assistance, which were both at 6.2%.

Despite the overall decline, four industries saw increases in job vacancies over the year including Utilities, Construction, Professional & Technical Services and Arts, Entertainment & Recreation. The remaining industries saw decreases, with the largest drops in Retail Trade, followed by Health Care & Social Assistance, Manufacturing and Finance & Insurance.
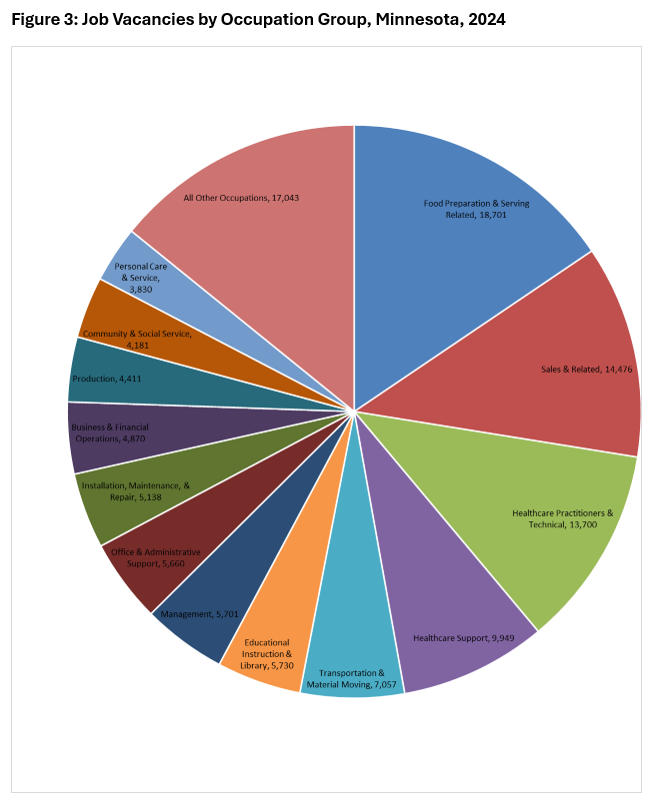
By occupational group, Food Preparation & Serving had the most job vacancies with 18,700 postings and a vacancy rate of 7.8%, followed by Sales & Related with 14,500 vacancies and a vacancy rate of 5.9%, Healthcare Practitioners & Technical with 13,700 openings and a vacancy rate of 7.3%, Healthcare Support with 9,950 openings and vacancy rate of 5.6% and Transportation & Material Moving with 7,100 openings and a vacancy rate of 3.1%.
Five occupational groups saw small increases compared to 2023: Sales & Related, Transportation & Material Moving, Management, Office & Administrative Support, Computer & Mathematical occupations. The number of openings for Internships also saw a small increase over the year. All other groups saw losses compared to 2023, with the largest decline in Personal Care & Service occupations.

The 10 detailed occupations with the most job vacancies during 2024 were Fast Food & Counter Workers with 5,089 openings, Retail Salespersons with 4,553 openings, First-line Supervisors of Food Prep & Serving Workers with 4,257 openings, Nursing Assistants with 3,896 openings, Cashiers with 3,766 openings, Personal Care Aides with 3,403 openings, Registered Nurses with 3,295 openings, Waiters & Waitresses with 2,681 openings, First-Line Supervisors of Retail Sales Workers with 2,292 openings and Food Preparation Workers with 2,044 openings.
By size, firms with between 10 and 49 employees had the highest job vacancy rate at 6.7%, followed by small firms with 1 to 9 employees at 5.4% and medium firms with 50 to 249 employees at 4.1%. The largest firms, those with 250 or more employees, had the lowest vacancy rate at 2.5%, but also had the highest median wage offer at $24.54 per hour.
Along with the number of vacancies, employers also report on the characteristics of their job vacancies. Some key characteristics of 2024 Minnesota job vacancies are as follows:
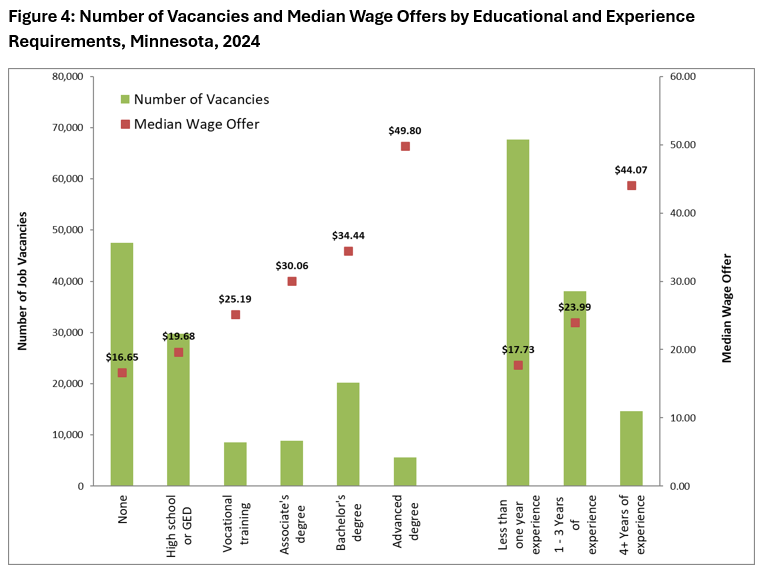
The median (50th percentile) wage offer for all job vacancies is $20.67 per hour in 2024. After raising almost $1 compared to last year, this is easily the highest median wage offer in the history of the Job Vacancy Survey, reflecting both employers offering higher starting wages and a changing mix of available occupations. As Figure 4 illustrates, wage offers are highly correlated with experience and education requirements.

Jobseekers and employers want to know who is hiring and for what fields of work. Job vacancy counts alone are not a complete picture of labor market demand since larger occupations tend to have higher numbers of vacancies. Occupations in Demand (OID) provides a ranked list of occupations currently in demand, along with links to occupational descriptions, wages and programs of study. Lists are available for Minnesota as well as the 6 sub-state planning regions. These lists use measures of demand from Job Vacancy Survey statistics as well as other sources of data including Unemployment Insurance claimants and Occupational Employment & Wage Statistics.
Employers provide information on their job vacancies twice a year to enable us to estimate hiring demand and job vacancy characteristics by industry, occupation and firm size in Minnesota. The information is gathered through a survey of 6,788 firms stratified by 6 regions of the state, 20 industry sectors, and 4 size classes. This sample is split between the two rounds, second and fourth quarters of each year. The 2024 survey had a response rate of 91.1% across both rounds.
These data provide job seekers and counselors with information on occupations showing hiring demand within their region. The information also helps employment, training and education providers understand current labor market conditions in their region and tailor services to better meet customer and employer needs. Finally, the data provides a leading labor market indicator.
The 2023 Job Vacancy Survey rolled out a new methodology that divides the sample and data collection across two rounds, second and fourth quarters of the year. The advantages of this methodology are that the time series going back to 2001 is maintained while the annual sample size, and thus the annual data collection and processing effort, is shrunk in half. 2024 continues this methodology with the analysis comparing year of 2024 to year of 2023 estimates.