

New Realities in the Metro Area’s Labor Market

By Tim O'Neill
Heading into the summer months of 2026, the Seven-County Twin Cities Metro Area has begun to experience the convergence of long-term trends and short-term shifts in its labor force and industry employment. On a longer time scale, the aging of the region's population and labor force has been offset with ever-increasing racial and ethnic diversity. More recently, the region's unemployment has risen, while employment growth has slowed down from the rapid growth witnessed coming out of the Pandemic Recession in 2021 and 2022. Among these major trends, Health Care & Social Assistance has continued to experience robust employment gains, helping to bolster employment despite losses among other industry sectors.
Labor Force Shifts
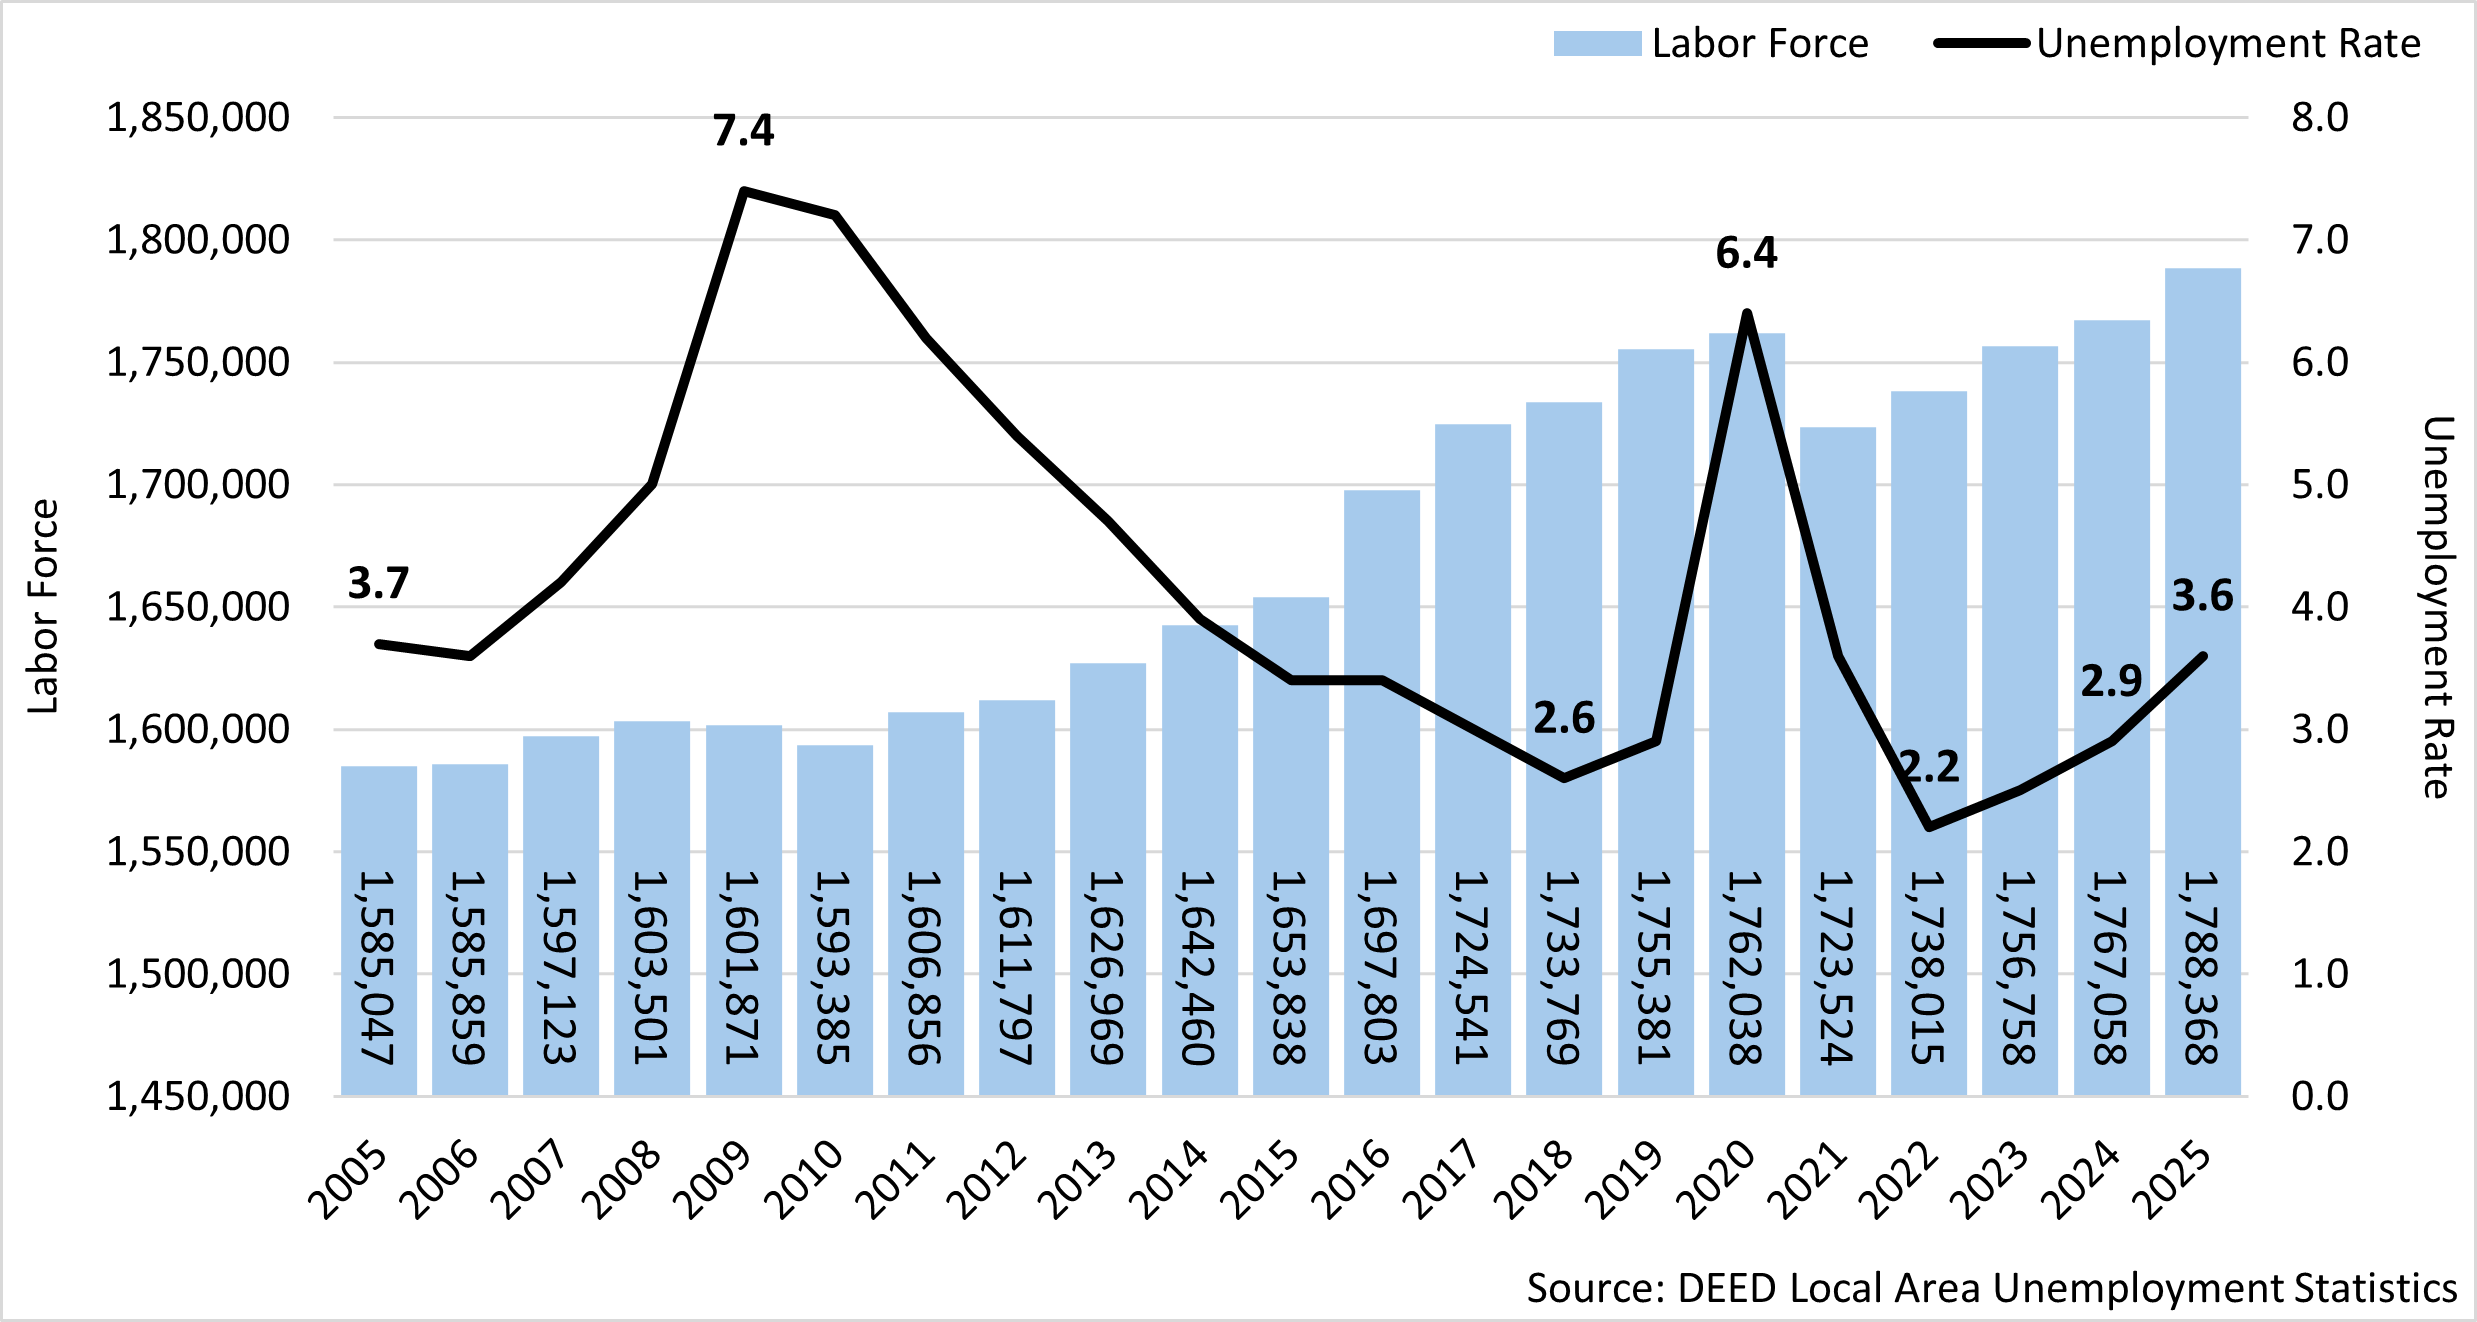
As in previous years, the Metro Area's labor force has shifted over the year. Between 2024 and 2025, the region's labor force increased by 21,310 people. This increase coincided with a rapid increase in unemployment, which spiked by 25.8% over the year. This spike was equivalent to an additional 13,281 unemployed people, bringing the total number of unemployed in 2025 for the region up to around 65,000 workers. Employment in the region also climbed, albeit at a much slower rate of 0.5%. This was equivalent to approximately 8,000 additional people who found jobs. With these shifts, the Metro Area's annual unemployment rate rose from 2.9% in 2024 to 3.6% in 2025 (Figure 1). For reference, Minnesota's unemployment rate rose from 3.1% in 2024 to 3.9% in 2025. The U.S. rate rose from 4.0% to 4.3%.
Figure 1. Seven County Twin Cities Metro Area Annual Labor Force Trends, 2005-2025
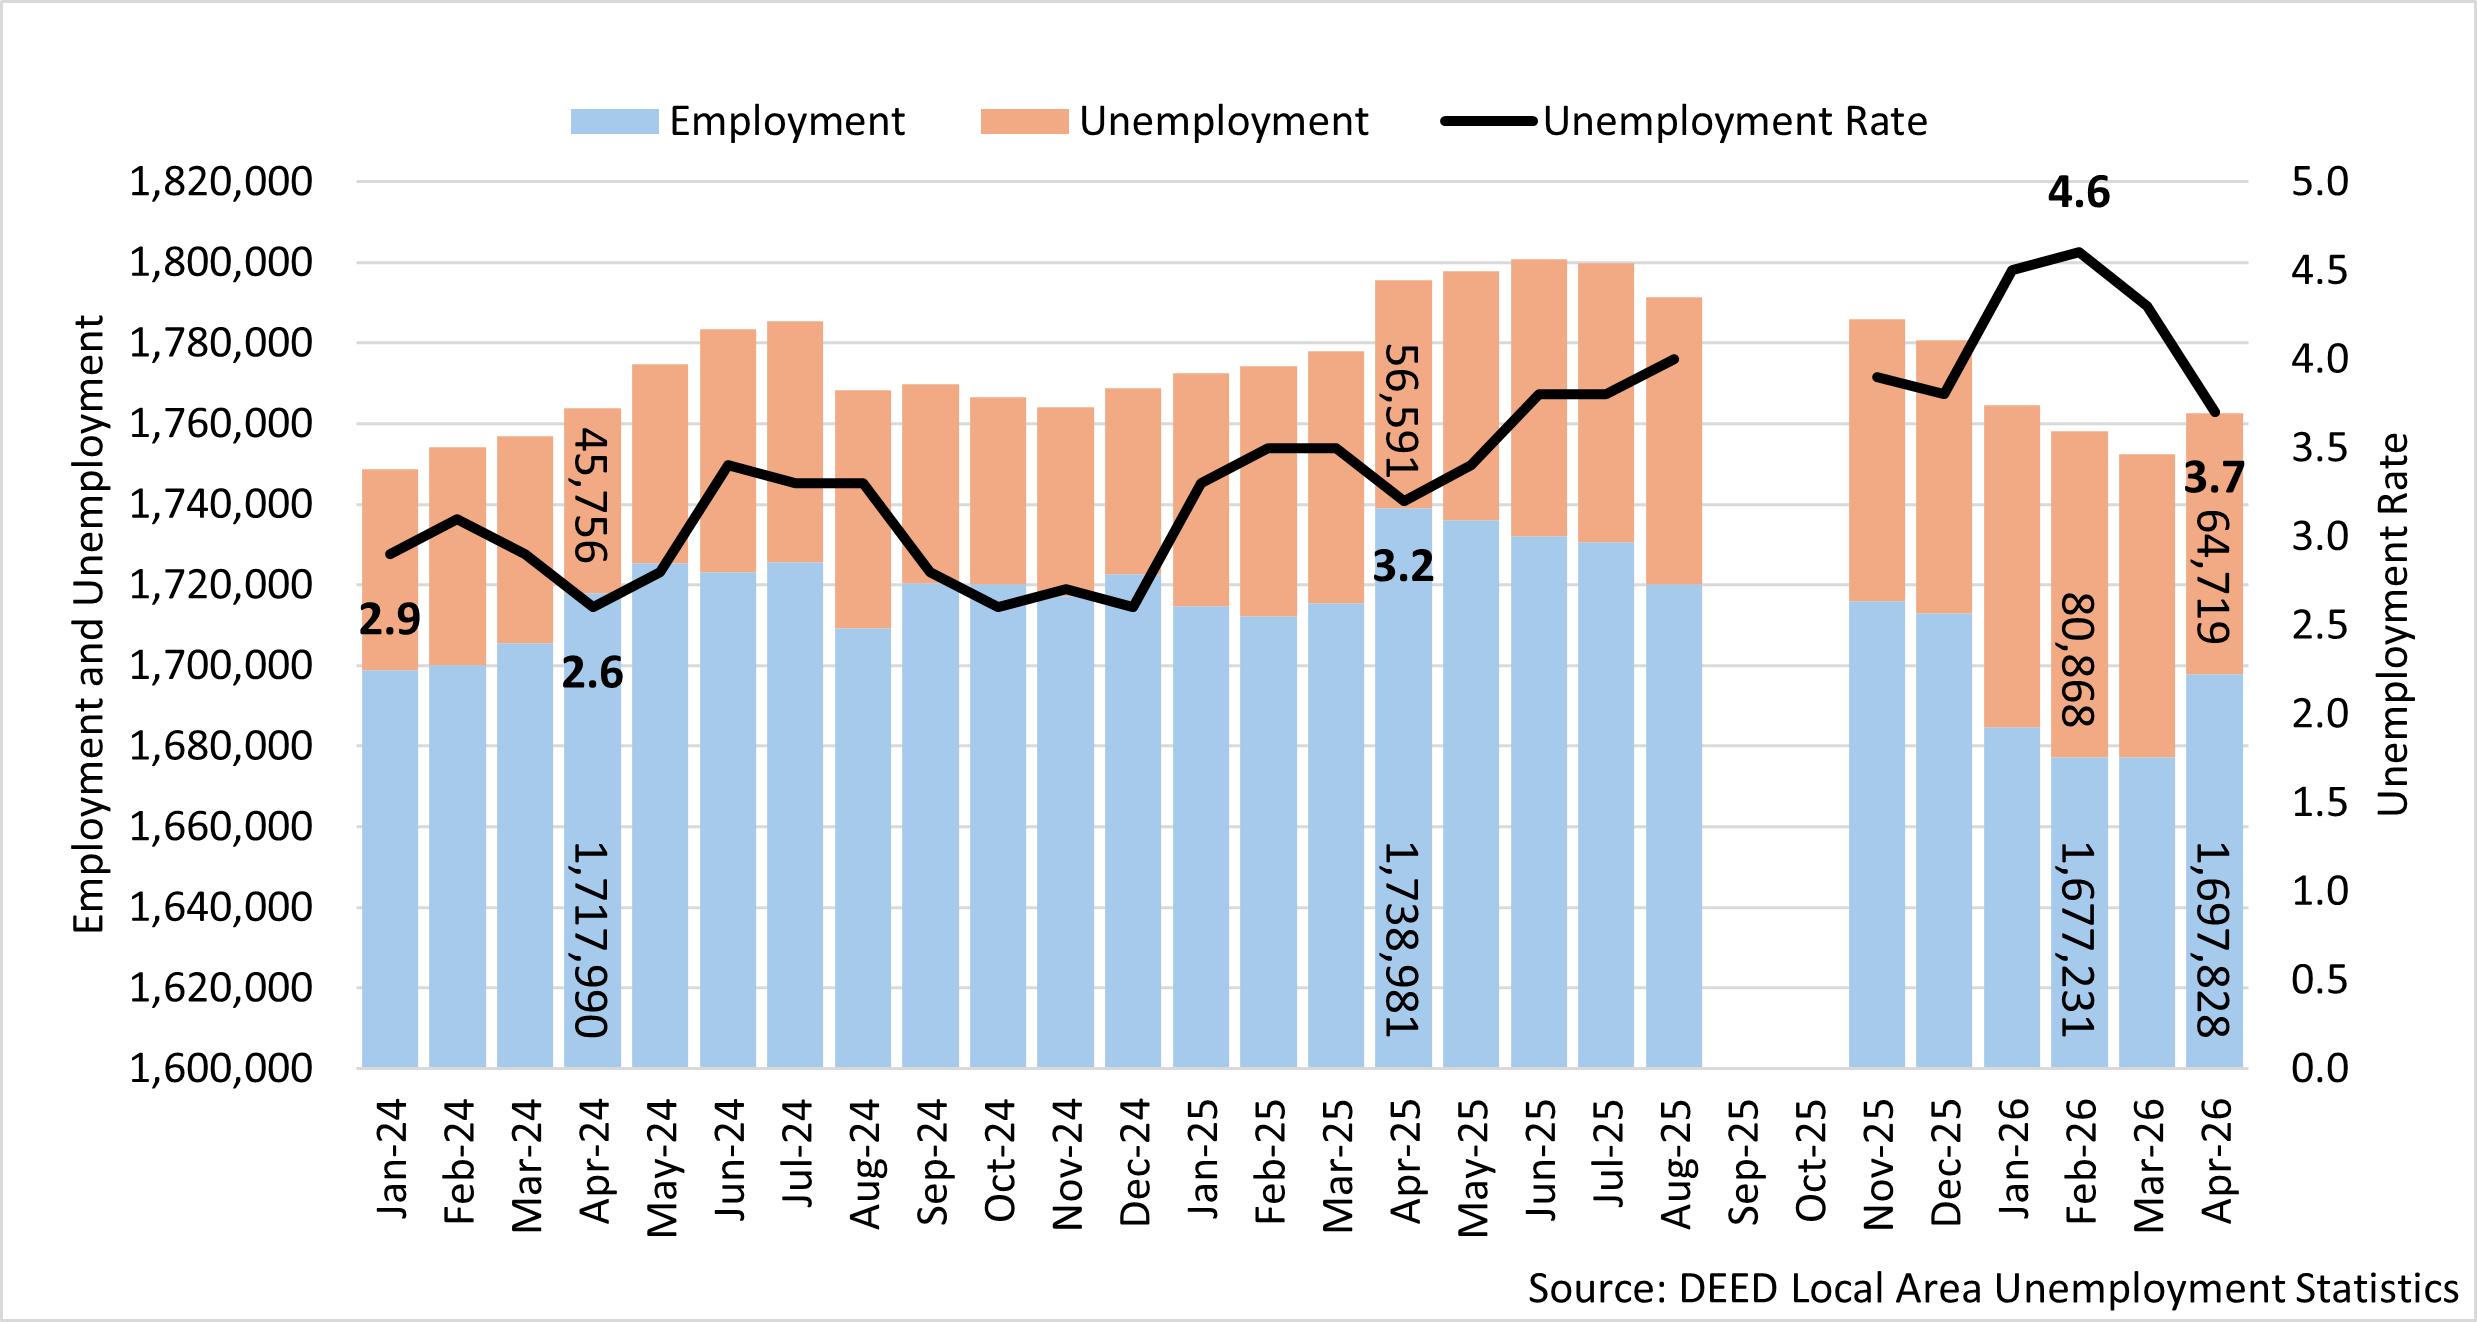
Zooming in upon monthly labor force trends reveals a more sporadic picture, as the Metro Area's labor market and economy reacted to shifting conditions from month to month and from season to season. Between April 2024 and February 2026, the region's unemployment rate increased from 2.6% to 4.6%. This two point increase in the unemployment rate was equivalent to more than 35,100 additional unemployed persons in the region.
As of April 2026, the Metro Area's unemployment rate decreased to 3.7%, equivalent to approximately 64,700 workers. While down from 4.6% in February, the rate for April 2026 was up from 3.2% in April 2025. This difference represents an increase of 8,128 unemployed people over the year. Meanwhile, the number of employed workers in the region declined by 41,153 over the year. Combined, the region's labor force was down by 33,025 people between April of 2025 and 2026 (Figure 2).
Figure 2. Metro Area Monthly Labor Force Trends, 2024-2026
All seven counties in the Metro Area witnessed annual labor force growth of 1.2% between 2024 and 2025. Annual unemployment rates in 2025 ranged from lows of 3.4% in Washington, Scott and Carver County, to highs of 3.8% in Ramsey County and 3.9% in Anoka County (Table 1).
| Area | Labor Force Size | 2024-2025
Labor Force Change |
Number of Unemployed | Unemp. Rate | |
|---|---|---|---|---|---|
| Numeric | Percent | ||||
| Metro Area | 1,788,368 | +21,310 | +1.2% | 64,832 | 3.6% |
| Hennepin County | 726,085 | +8,490 | +1.2% | 26,114 | 3.6% |
| Ramsey County | 291,837 | +3,572 | +1.2% | 11,033 | 3.8% |
| Dakota County | 253,836 | +3,132 | +1.2% | 9,077 | 3.6% |
| Anoka County | 207,747 | +2,502 | +1.2% | 8,031 | 3.9% |
| Washington County | 153,251 | +1,774 | +1.2% | 5,278 | 3.4% |
| Scott County | 91,371 | +1,071 | +1.2% | 3,145 | 3.4% |
| Carver County | 64,241 | +769 | +1.2% | 2,154 | 3.4% |
| Minnesota | 3,171,537 | +33,978 | +1.1% | 124,499 | 3.9% |
| United States | 170,807,272 | +2,701,106 | +1.6% | 7,314,545 | 4.3% |
| Source: DEED Local Area Unemployment Statistics | |||||
Slowing Employment Growth
DEED's Quarterly Census of Employment & Wages (QCEW) allows for in-depth analysis of the seven county Twin Cities Metro Area's industry employment and trends. According to this data, the Metro Area had an average of 93,678 employer establishments supplying 1,771,774 covered jobs in 2025. As such, the Twin Cities is the largest-employing planning region in Minnesota, accounting for three-fifths (60.2%) of the state's total employment. Any employment distribution or industry change in the Metro Area is going to have a profound impact on the state's total employment and industry shifts.
Broken down by ownership, most of the Metro Area's total employment is in the private sector. In fact, with 1,556,167 jobs, nearly nine-in-ten jobs in the region (87.8%) are private sector jobs. Government employment, with 215,607 jobs, accounts for the remaining 12.2% of the region's total employment. Of these government jobs, 63% are local government jobs, 28% are state government jobs and the remaining 9% are federal government jobs. Over the year, between annual 2024 and 2025, private sector employment growth lagged government employment growth. More specifically, where private sector employment increased by 0.2% (+2,969 jobs), total government employment increased by 1.7% (+3,633 jobs). State government employment (+2.9%; +1,715 jobs) and local government employment (+1.8%; +2,410 jobs) made up for losses over the year in federal government employment (-2.5%; -493 jobs).
Focusing on total employment across all ownerships, the Metro Area witnessed an increase of 6,601 jobs between 2024 and 2025. This 0.4% growth rate was slightly elevated compared to Minnesota's growth rate of 0.3% during that period. Like Minnesota, however, annual employment growth in the Metro Area has been slowing in recent years. After a COVID-related employment loss of -7.4% between 2019 and 2020, the region's employment increased by 2.1% (+34,490 jobs) between 2020 and 2021, and then by 3.0% (+50,809 jobs) between 2021 and 2022. This growth slowed to 1.6% (+27,282 jobs) between 2022 and 2023, and then to 0.4% in each of the following two years. For some perspective, the Metro Area averaged annual employment growth of 1.6% (+26,600 jobs per year) between 2011 and 2019 (Figure 3).
Figure 3. Metro Area Annual Employment Trends, 2010-2025

Zooming in on the Metro Area's counties can provide greater understanding of the region's recent employment shifts. Between 2019 and 2025, the Twin Cities' total employment was still down by 0.3% (-4,665 jobs). This loss of employment can be attributed to the region's three largest-employing counties: Hennepin County (-2.1%; -19,501 jobs), Ramsey County (-1.4%; -4,716 jobs) and Dakota County (-1.3%; -2,474 jobs). The remaining four counties added jobs during this period: Scott County (+16.3%; +8,957 jobs), Washington County (+9.1%; +8,010 jobs), Anoka County (+3.9%; +5,049) and Carver County (+0.0%; +11 jobs). In fact, of the 87 total counties in the state, the most extreme employment losses and gains between 2019 and 2025 were mostly in the Metro Area (Table 2).
Most recently, Ramsey County (+1.5%; +4,783 jobs) and Hennepin County (+0.1%; +1,268 jobs) led the Metro Area in employment growth between 2024 and 2025. Washington County (+0.8%; +787 jobs) and Scott County (+1.0%; +642 jobs) also witnessed growth during this period. However, Dakota County (-0.2%; -392 jobs), Carver County (-0.7%; -284 jobs) and Anoka County (-0.2%; -204 jobs) witnessed employment losses over this period.
Over the past decade, between 2015 and 2025, all seven Metro Area counties experienced strong employment gains. Hennepin County, which added 34,756 jobs during this period, led all of Minnesota's counties in total new jobs. Scott County, growing by 40.9%, led all of Minnesota's counties in employment growth rate. For the region's decade of employment growth:
- Hennepin County: +34,756 jobs (+3.9%)
- Scott County: +18,495 jobs (+40.9%)
- Washington County: +17,314 jobs (+21.9%)
- Anoka County: +14,388 jobs (+12.1%)
- Dakota County: +4,982 jobs (+2.7%)
- Ramsey County: +3,458 jobs (+1.1%)
- Carver County: +3,089 jobs (+8.2%)
| Area | Number of Establishments | Number of Jobs | Total Payroll ($1,000s) | Avg. Annual Wage | 2019 – 2025 Job Change | |
|---|---|---|---|---|---|---|
| Numeric | Percent | |||||
| Hennepin County | 43,936 | 918,267 | $84,776,447 | $92,352 | -19,501 | -2.1% |
| Ramsey County | 15,199 | 330,650 | $26,895,831 | $81,328 | -4,716 | -1.4% |
| Dakota County | 11,898 | 189,025 | $14,117,392 | $74,672 | -2,474 | -1.3% |
| Anoka County | 8,789 | 133,012 | $9,027,923 | $67,860 | +5,049 | +3.9% |
| Washington County | 7,028 | 96,453 | $6,112,365 | $63,388 | +8,010 | +9.1% |
| Scott County | 3,980 | 63,768 | $4,210,422 | $65,988 | +8,957 | +16.3% |
| Carver County | 2,850 | 40,598 | $3,104,019 | $76,596 | +11 | +0.0% |
| Metro Area | 93,678 | 1,771,774 | $148,244,401 | $83,668 | -4,665 | -0.3% |
| Minnesota | 213,477 | 2,943,166 | $226,470,727 | $76,960 | +41,534 | +1.4% |
| Source: DEED Quarterly Census of Employment and Wages (QCEW) | ||||||
Health Care Domination
With 15,398 establishments supplying 321,378 covered jobs, Health Care & Social Assistance is the Metro Area's largest-employing industry sector. In fact, it's the largest-employing sector by over 150,000 jobs. This vital industry in the region can be broken down into four main subsectors: Ambulatory Health Care Services (97,289 jobs in the Metro Area), Social Assistance (93,261 jobs), Hospitals (69,038 jobs) and Nursing & Residential Care Facilities (61,790 jobs) (Table 3). Not only is Health Care & Social Assistance the largest-employing in the Metro Area, but it also happens to be the largest-growing. Between 2019 and 2025, this industry added 42,431 jobs with a growth rate of 15.2%. Without its presence, the remaining industries in the region would have lost more than 47,000 jobs during that period. While employment growth was experienced in each of this industry's subsectors, it was Social Assistance that led the way (+22,715 jobs; +32.2%).
Along with Health Care & Social Assistance, other Metro Area industries that were experiencing significant employment growth between 2019 and 2025 included Public Administration, Construction, Transportation & Warehousing, and Educational Services. Industries losing a significant number of jobs included Finance & Insurance; Administrative Support & Waste Management Services; Retail Trade; Information; Management of Companies; Accommodation & Food Services; Professional, Scientific & Technical Services; Manufacturing; and Other Services (Table 4).
| Industry | Number of Establishments | Number of Jobs | Share of MN Jobs | Total Payroll ($1,000s) | Avg. Annual Wage |
|---|---|---|---|---|---|
| Total, All Industries | 93,678 | 1,771,774 | 100.0% | $148,244,401 | $83,668 |
| Health Care & Social Assistance | 15,398 | 321,378 | 18.1% | $21,823,162 | $67,860 |
| Manufacturing | 3,903 | 169,752 | 9.6% | $16,499,846 | $97,188 |
| Retail Trade | 8,156 | 151,817 | 8.6% | $6,634,888 | $43,680 |
| Educational Services | 2,438 | 140,020 | 7.9% | $9,618,023 | $68,484 |
| Accommodation & Food Services | 6,540 | 133,852 | 7.6% | $4,186,963 | $31,252 |
| Professional, Sci., & Technical Services | 12,007 | 122,182 | 6.9% | $15,919,364 | $130,312 |
| Finance & Insurance | 5,059 | 98,888 | 5.6% | $15,130,173 | $152,932 |
| Construction | 7,119 | 82,958 | 4.7% | $8,403,011 | $101,348 |
| Administrative & Support Services | 4,691 | 82,579 | 4.7% | $4,701,281 | $56,888 |
| Public Administration | 789 | 82,113 | 4.6% | $7,209,712 | $87,828 |
| Transportation & Warehousing | 2,109 | 78,726 | 4.4% | $6,053,916 | $76,908 |
| Wholesale Trade | 5,205 | 77,154 | 4.4% | $8,900,010 | $115,336 |
| Management of Companies | 1,063 | 71,447 | 4.0% | $11,219,072 | $156,936 |
| Other Services | 10,556 | 56,022 | 3.2% | $2,956,271 | $52,780 |
| Arts, Entertainment, & Recreation | 1,906 | 37,425 | 2.1% | $2,202,147 | $58,968 |
| Real Estate & Rental & Leasing | 4,252 | 27,059 | 1.5% | $2,122,350 | $78,468 |
| Information | 2,033 | 26,889 | 1.5% | $3,384,084 | $125,684 |
| Utilities | 126 | 7,140 | 0.4% | $1,025,493 | $143,780 |
| Agriculture | 292 | 3,800 | 0.2% | $172,966 | $45,552 |
| Mining | 40 | 571 | 0.0% | $81,667 | $148,928 |
| Source: DEED Quarterly Census of Employment and Wages (QCEW) | |||||
Analyzing more recent employment trends yields similar results. Between 2024 and 2025, Health Care & Social Assistance led job growth by a significant margin. Over the year, this industry gained 16,633 jobs, growing by 5.5%. This rate of growth was nearly 14 times the growth rate across all industries. Eight of 20 major industries gained jobs in the Metro Area between 2024 and 2025. Health Care & Social Assistance accounted for about two-thirds (64.9%) of this total growth. Without these robust gains in Health Care & Social Assistance, the region would have lost just over 10,000 jobs over the past year. Analyzing this industry in-depth, Social Assistance again led the way by gaining 8,961 jobs (+10.6%). Nursing & Residential Care Facilities welcomed 4,072 additional jobs (+7.1), Ambulatory Health Care Services expanded by 2,446 jobs (+2.6%) and Hospitals added 1,154 jobs (+1.7%).
Other industries gaining jobs between 2024 and 2025 included Construction (+2,902 jobs; +3.6%); Public Administration (+2,220 jobs; +2.8%); Educational Services (+2,060 jobs; +1.5%); Arts, Entertainment & Recreation (+1,445 jobs; +4.0%); Agriculture (+221 jobs; +6.2%); Utilities (+105 jobs; +1.5%); and Mining (+39 jobs; +7.3%). Industries losing a significant number of jobs during this period included Retail Trade (-3,671 jobs; -2.4%); Manufacturing (-3,106 jobs; -1.8%); Management of Companies (-2,767 jobs; -3.7%); Professional, Scientific & Technical Services (-2,126 jobs; -1.7%); Information (-1,837 jobs; -6.4%); Administrative Support & Waste Management Services (-1,761 jobs; -2.1%); and Accommodation & Food Services (-1,328 jobs; -1.0%) (Table 4).
| Industry | 2025 Number of Jobs | 2024 – 2025 Job Change | 2019 – 2025 Job Change | ||
|---|---|---|---|---|---|
| Numeric | Percent | Numeric | Percent | ||
| Total, All Industries | 1,771,774 | +6,601 | +0.4% | -4,665 | -0.3% |
| Health Care & Social Assistance | 321,378 | +16,633 | +5.5% | +42,431 | +15.2% |
| Manufacturing | 169,752 | -3,106 | -1.8% | -3,309 | -1.9% |
| Retail Trade | 151,817 | -3,671 | -2.4% | -13,001 | -7.9% |
| Educational Services | 140,020 | +2,060 | +1.5% | +4,864 | +3.6% |
| Accommodation & Food Services | 133,852 | -1,328 | -1.0% | -7,242 | -5.1% |
| Professional, Sci., & Technical Services | 122,182 | -2,126 | -1.7% | -3,791 | -3.0% |
| Finance & Insurance | 98,888 | -684 | -0.7% | -16,188 | -14.1% |
| Construction | 82,958 | +2,902 | +3.6% | +7,245 | +9.6% |
| Administrative & Support Services | 82,579 | -1,761 | -2.1% | -14,706 | -15.1% |
| Public Administration | 82,113 | +2,220 | +2.8% | +9,008 | +12.3% |
| Transportation & Warehousing | 78,726 | -362 | -0.5% | +4,929 | +6.7% |
| Wholesale Trade | 77,154 | -696 | -0.9% | +23 | +0.0% |
| Management of Companies | 71,447 | -2,767 | -3.7% | -7,461 | -9.5% |
| Other Services | 56,022 | -633 | -1.1% | -1,323 | -2.3% |
| Arts, Entertainment, & Recreation | 37,425 | +1,445 | +4.0% | +898 | +2.5% |
| Real Estate & Rental & Leasing | 27,059 | -52 | -0.2% | -389 | -1.4% |
| Information | 26,889 | -1,837 | -6.4% | -8,333 | -23.7% |
| Utilities | 7,140 | +105 | +1.5% | +918 | +14.8% |
| Agriculture | 3,800 | +221 | +6.2% | +727 | +23.7% |
| Mining | 571 | +39 | +7.3% | +38 | +7.1% |
| Source: DEED Quarterly Census of Employment and Wages (QCEW) | |||||
A finer look at the specific industries which gained or lost the most jobs between 2024 and 2025 can provide for a greater understanding of employment shifts in the Metro Area. At the 3-digit level of the North American Industry Classification System (NAICS) codes, the industries gaining the most jobs in the region over the past year included:
- Social Assistance: +8,961 jobs (+10.6%)
- Nursing & Residential Care Facilities: +4,072 jobs (+7.1%)
- Ambulatory Health Care Services: +2,446 jobs (+2.6%)
- Educational Services: +2,060 jobs (+1.5%)
- Specialty Trade Contractors: +1,959 jobs (+3.8%)
- Executive, Legislative, & Other General Government Support: +1,816 jobs (+4.9%)
- Amusement, Gambling, & Recreation Industries: +1,526 jobs (+6.9%)
- Hospitals: +1,154 jobs (+1.7%)
- Administrative of Human Resource Programs: +698 jobs (+5.7%)
- Construction of Buildings: +629 jobs (+3.4%)
The in-depth industries that lost the most jobs over that same period included:
- Management of Companies: -2,767 jobs (-3.7%)
- Professional, Scientific, & Technical Services: -2,126 jobs (-1.7%)
- Administrative & Support Services: -1,783 jobs (-2.2%)
- Miscellaneous Manufacturing: -1,405 jobs (-6.4%)
- Food Services & Drinking Places: -1,216 jobs (-1.0%)
- Sporting Goods, Hobby, Musical Instrument, Book, & Miscellaneous Retailers: -1,152 jobs (-6.7%)
- Food & Beverage Stores: -1,094 jobs (-3.7%)
- Insurance Carriers & Related Activities: -981 jobs (-2.1%)
- Internet Service Providers, Web Search Portals, & Data Processing Services: -886 jobs (-15.1%)
- Truck Transportation: -873 jobs (-6.9%)
To provide some clarifying data, the recent annual gains in Social Assistance were led by Individual & Family Services (+8,196 jobs; +12.8%). This sector includes Child & Youth Services, Services for the Elderly & Persons with Disabilities and Other Individual & Family Services. Meanwhile, the recent annual losses in Miscellaneous Manufacturing were largely due to losses in Medical Equipment & Supplies Manufacturing (-1,021 jobs; -5.8%) and Other Miscellaneous Manufacturing (-384 jobs; -8.5%).
The Changing Face of Regional Employment
Analyzing employment demographics can provide even more understanding of the Metro Area's employment shifts over the past several years. Interestingly, data from the U.S. Census Bureau's Quarterly Workforce Indicators (QWI) reveals that that region gained 9,602 jobs (+0.5%) between the third quarters of 2019 and 2025. Workforce demographics broken down by age highlights how the region's workforce is becoming older. Where total employment increased by 0.5% during that time, the share of jobs held by workers 65 years of age and older increased by 27.2%. The data also shows the steepest decline for workers between the ages of 55 and 64 years (-4.6%). This makes sense as Baby Boomers, between the ages of 61 and 79 in 2025, aged into the oldest cohorts. Younger cohorts, including those in the prime working age group between 25 and 54 years of age, witnessed slight decreases between 2019 and 2025 (Tabe 5).
In terms of race and ethnicity, recent trends show the Metro Area's workforce became significantly more diverse between 2019 and 2025. Where the share of jobs in the region held by white workers decreased by 2.9%, all other races witnessed increases. The share of jobs held by those reporting two or more races increased by 21.4%, the share of jobs held by those reporting as Black or African American increased by 15.3%, the share of jobs held by American Indian and Alaska Natives increased by 13.5%, and the share of jobs held by those reporting as Asian or Other Pacific Islander increased by 11.6%. Meanwhile, those reporting Hispanic or Latino origins saw their representation in the region's workforce increase by 31.4% between 2019 and 2025, equivalent to approximately 31,000 jobs.
| Population | Q2 2025 Share of Employment | Q2 2019 – Q2 2025 Employment Change | |
|---|---|---|---|
| Numeric | Share | ||
| Total | 100.0% | +9,602 | +0.5% |
| AGE | |||
| Less than 24 years | 13.6% | -1,072 | -0.4% |
| 25 – 54 years | 63.6% | -2,050 | -0.2% |
| 55 – 64 years | 15.9% | -14,188 | -4.6% |
| 65+ years | 6.9% | +26,908 | +27.2% |
| RACE & ETHNICTY | |||
| White | 77.9% | -42,585 | -2.9% |
| Black or African American | 10.3% | +25,788 | +15.3% |
| American Indian or Alaska Native | 0.8% | +1,746 | +13.5% |
| Asian or Other Pacific Islander | 8.3% | +15,895 | +11.6% |
| Two or More Races | 3.0% | +8,760 | +21.4% |
| Hispanic or Latino (of any race) | 7.0% | +30,981 | +31.4% |
| GENDER | |||
| Male | 49.5% | -8,021 | -0.9% |
| Female | 50.5% | +17,626 | +1.9% |
| Source: Census Bureau, Quarterly Workforce Indicators | |||
Finally, the Metro Area's workforce has become more female in recent years. Between 2019 and 2025, the share of jobs held by male workers decreased by 0.9%, equivalent to approximately 8,000 jobs. During that same period, the share of jobs held by female workers increased by 1.9%, equivalent to approximately 17,600 jobs. It is likely there is a correlation between this strong increase in female-held jobs in the region and the significant increase in Health Care & Social Assistance employment. In 2025, nearly three-quarters (74.1%) of the Metro Area's total jobs in Health Care & Social Assistance were held by female workers.
The State of the Region
As the Metro Area's unemployment rate ticks upward while employment growth slows, career seekers and employers alike will need to adapt. Those looking to break into the job market or transition between jobs will need to keep up with which industries are growing and may be looking to hire. Examples of these industries include Health Care & Social Assistance, Construction and Public Administration. Career seekers, in current conditions, will likely find high competition for open positions. Alternative pathways, including apprenticeships and certification, may be the key to securing new work.
Employers, for their part, will need to keep up with changing demographics in the region. Finding and retaining talent will need to include all Minnesotans: younger workers and recent graduates, older workers and retirees looking to break back into the labor market, immigrants, persons with disabilities, veterans, persons with a criminal record looking for a second chance, and everyone in between.