
The Effect of Childhood Poverty on the Wages of Minnesota High School Graduates

by Alessia Leibert
September 2025
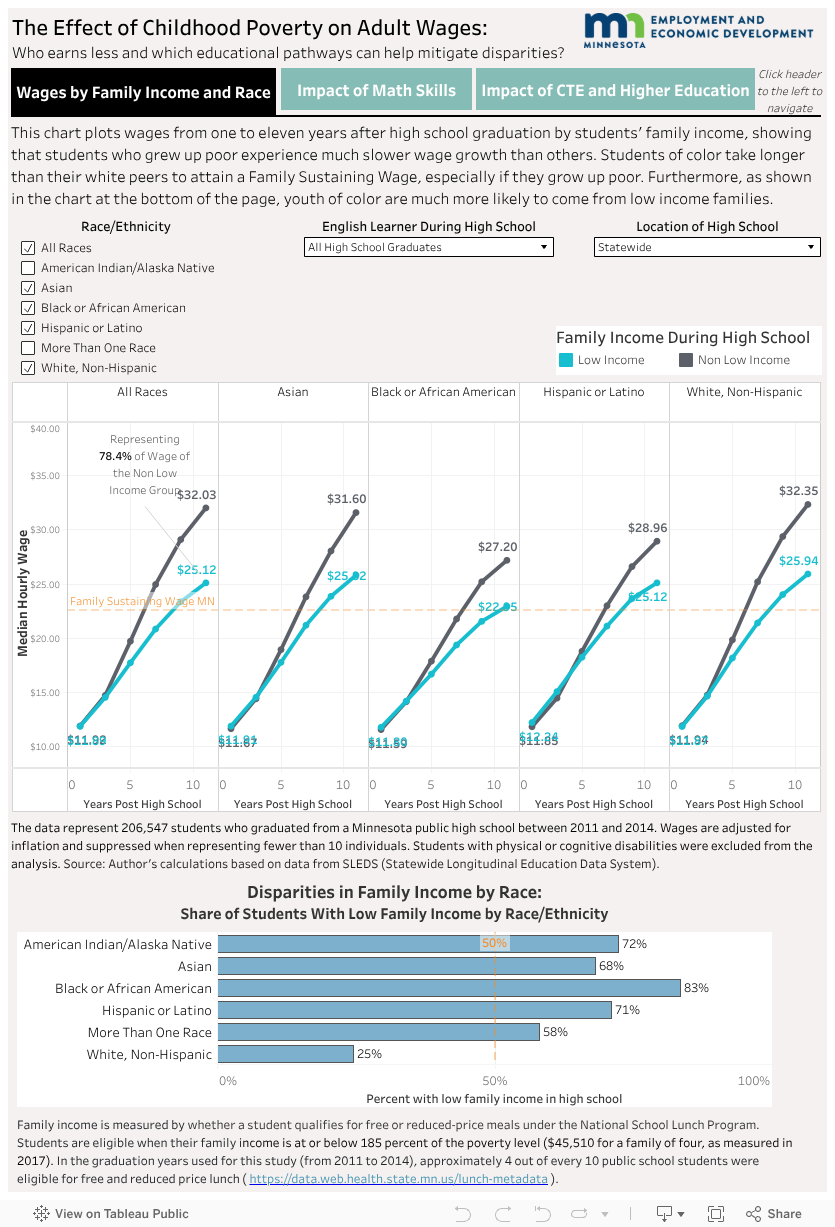
The newly launched data visualization tool called The Effect of Childhood Poverty on Adult Wages explores economic mobility among Minnesota high school graduates who enter the workforce, comparing the wages of students from low-income families to those of other students. Family income is measured by whether students received free and reduced-price lunch benefits during high school1. The first tab of the tool, shown in Figure 1, plots median hourly wages in the first 11 years after high school, distinguishing between individuals from families with low income (blue line) and those from higher income families (black line). The tool and article address the following questions:
- How large is the gap in wages earned by graduates from low-income families relative to graduates from wealthier families?
- What barriers do low-income students face to attaining a family-sustaining wage? We will examine the effect of K-12 academic skills, school characteristics and postsecondary attainment to see how wage gaps could be reduced through interventions in these domains.
Interactive filters allow users to slice the data by characteristics like race/ethnicity, English learner status and location of high school. The data represent 210,923 public high school graduates, the population of high school graduates in years 2011 to 2014.
Figure 1
The key takeaways from this evidence are:
- Low-income students took nine years to reach the Minnesota family-sustaining wage2 of $22.53 (orange dotted line), while their higher-income peers took seven years. Students from low-income families experienced slower wage growth overall.
- Eleven years post-graduation, low-income students earned a median wage of $25.25. This represents 78.7% (approximately three-fourths) of the non-low-income group's wage. These percentages can be looked up in the tooltip corresponding to 11th year earnings for the low-income group.
- Expanding the view to specific race/ethnicity categories reveals that white students of low income fared better than others, reaching a median wage of $26.08 in the 11th year.
- Filtering these results by region of schooling reveals the same patterns: low-income students of American Indian and Black/African American background took the longest (11 years) to reach a family-sustaining wage.
- Filtering the results by English learner status, which is indicative of recent immigrants from non-English speaking countries, shows starkly lower wages than others. This is true for both the low-income and non-low-income group. This suggests that foreign-born youth with English language barriers are more likely than others to land low-wage jobs out of high school and stay in these low-wage jobs longer.
Finally, the bar chart at the bottom of Figure 1 illustrates the strong correlation between family income and race. Black/African American students had the highest poverty rate at 83%, or four out of five individuals. White students had the lowest poverty rate at 25%, or one out of four individuals.
Characteristics of Minnesota Students from Low-income Families
Poverty is often associated with other characteristics that are associated with lower earnings. As shown in Figure 2, some student characteristics were associated with a disproportionate concentration of individuals from poor families. Shares greater than 36% (red dotted line), representing a disproportionate concentration, occurred among students who were not white, received English language services and attended school in the most rural regions of the state, especially Northeast and Northwest.
Figure 2

These characteristics, alongside low income, decrease the likelihood that these Minnesota youth will break out of the cycle of poverty.
Math Preparation as a Critical Barrier
The second and third tabs of the tool examine the two most important factors determining whether students attained a family-sustaining wage by age 30: academic skills in math (visualized in tab 2) and postsecondary educational attainment (visualized in Tab 3).
Students from low-income backgrounds lag behind their higher income peers in academic preparation even before entering high school. In our sample, there is gap of 28 percentage points between low-income and non-low-income students in math proficiency in 8th grade (see Figure 3). Only 47% of low-income graduates were proficient in 8th grade math compared to 75% of their wealthier peers. A smaller, yet still sizable, gap exists in reading proficiency in 10th grade.
Figure 3

When lower income students perform this much worse than higher income students, the achievement gap is not simply academic but socio-economic.
Both math and reading skills are strongly linked to increased lifetime earnings, with math being the most critical. The second tab of the tool, reproduced in Figure 4, illustrates this finding. Weak math skills in 8th grade can set students on a flatter wage trajectory. This is true for both income groups. Low-income students not proficient in math took the longest to attain a family-sustaining wage: nearly 11 years, corresponding to an age of 29 for most individuals in our dataset.
Figure 4

Students who exceeded proficiency significantly outearned others in the 11th year after graduation. Low-income students who exceeded proficiency reached a median wage of $30.24 while their higher income peers reached $37.17. Math skills can open doors to more advanced educational opportunities in high school and training programs in college, ultimately leading to higher earning careers.
Figure 4 also shows a small, though important, role of math skills in driving the gap between the blue (students from low-income families) and the black (students from non-low-income families) line. Figure 1 showed a ratio of 78.7% between the wage of the low-income group and that of the higher income group in the 11th year. Accounting for differences in math skills results in bigger ratios: 83.2% among those who met proficiency in math. Bigger ratios are encouraging because they indicate smaller disparities.
In conclusion, the negative effect of growing up poor can be mitigated by improving foundational math skills before entering high school. However, the stubbornness of these wage gaps suggests that improvements in math alone are not enough. High achieving students from poor families may choose not to pursue college for financial reasons3, missing opportunities to fully realize their potential.
Last but not least, using the tool's filters uncovers large disparities in wage outcomes across race that cannot be explained by differences in 8th grade math4.
Disparities in School Characteristics
Addressing socio-economic achievement gaps is challenging due to systemic differences in school settings between low-income students and others. Poverty hinders learning in a variety of ways, ranging from family factors such as limited parental resources of time and money, to school factors such as the disproportionate concentration of low-income children in high poverty schools. In terms of family factors, children from low-income families are significantly more likely to be first-generation college students5 than their higher income peers. Therefore, they often lack the support from their immediate family to navigate the complexities of higher education.
In terms of school factors, Figure 5 shows that 13% of low-income students attended schools with high poverty concentration, defined as having 75% or more students eligible for Free/Reduced Price Lunch. In contrast, only 0.5% of non-low-income students attended high poverty schools, while half (50%) attended low poverty schools.
Figure 5

High poverty schools tend to be under-resourced, which can hinder learning. This was documented in a study called How the Deck is Stacked: Racial and Ethnic Disparities in Earnings Following High School Graduation in Minnesota, showing that children from low-income families were more likely to attend schools with lower math scores and disproportionately high rates of inexperienced teachers.
While poverty affects students of all races, white students of low family income were far less likely to attend a high poverty school than students of other races. Only 2% of white students did so, compared to 39% of low-income Asian students, 27% of Black students, 25% of American Indian students and 17% of Hispanic/Latino students. These differences are tied, in part, to the fact that children from certain racial backgrounds spend longer time in poverty than others.
Opportunity Gaps in High School Lead to Postsecondary Education Gaps Along Socio-Economic Lines
Partially because of disparities in K-12 school settings, low-income students are less likely to participate in advanced coursework in high school. Table 1 shows that only 15% of low-income students in our dataset took Advanced Placement (AP) courses versus 38% of wealthier students. Economically disadvantaged children are also less likely, 21% versus 33%, to take rigorous courses such as PSEO or Concurrent Enrollment.| Table 1- Shares of Students Taking College Preparatory and College-level Courses in High School by Family Income, Graduation Years 2011-2014 | |||
|---|---|---|---|
| Family Income in High School | Took Advanced Placement (AP) courses | Took PSEO or Concurrent Enrollment* courses | Total |
| Low-income | 15% | 21% | 36% |
| Non low-income | 38% | 33% | 70% |
| Total | 61,883 | 60,087 | 210,922 |
| * PSEO (Postsecondary Enrollment Options) and Concurrent Enrollment are programs in Minnesota that allow high school students to earn college credit while still in high school. The difference is that PSEO allows students to take courses at a college or university campus, while Concurrent Enrollment courses are offered at the high school and taught by high school teachers who are often mentored by college faculty.
Source: Author's calculations based on data from SLEDS. |
|||
The third tab of the tool shows how participation in AP courses boosted the wages of all students, regardless of family income level and postsecondary credential completion.
These different educational paths in high school, combined with weaker academic preparation and family financial constraints, led to reduced postsecondary educational attainment among low-income students. Eighty percent of low-income students in our dataset enrolled in postsecondary school versus 92% of their wealthier peers. Of this 80%, almost one out of three (29%) took remedial courses, which are necessary to fill academic gaps but also reduce students’ motivation and delay their progress.
Figure 6 documents the disparities in college completion rates. The majority (58%) of low-income students did not complete any postsecondary credential. This jeopardizes their long-term earning potential, ultimately limiting economic mobility.
Figure 6

Conclusions
This study followed 210,923 Minnesota high school graduates in the labor market from age 18 to 29 to assess the gap in wages between students from low-income families and others. Our purpose was to document the effects of growing up poor on wages and identify factors that, if not addressed, can perpetuate the cycle of intergenerational poverty. Here is a summary of findings:
- Eleven years after high school, a child who lived in a poor family earned 78.7% of the wage earned by children from wealthier families. This means that the wage penalty associated with growing up poor was 78.7%.
- Low-income students took nine years to reach the Minnesota family-sustaining wage of $22.53, while their higher income peers took less than seven years.
- Besides family income, race is a factor determining how long it takes to attain a family-sustaining wage. Low-income students of American Indian and Black/African American background took nearly 11 years after high school to reach that milestone, while their white counterparts took less than nine years.
- Low-income students tend to have other characteristics associated with low wages, including needing English language services, attending high poverty schools, and being first-generation college students. Addressing these multiple barriers requires a comprehensive support system from K-12 through college.
- Weak academic preparation is one of many reasons contributing to slower wage growth among low-income students. Interventions aimed at improving math preparation before 8th grade can help these students reduce the wage gap with their wealthier peers.
- Children who grew up poor were also less likely than others to take the courses in high school to set them up for college success, such as Advanced Placement and PSEO. They also had significantly lower rates of postsecondary credential completion than their wealthier peers.
Wages in the first 11 years after high school shape an individual’s long-term economic success. Slow wage growth during these early working years limits not only people’s ability to start a family but also their chances to invest in higher education, perpetuating poverty in already marginalized groups. The reduction in future earning potential for individuals who experienced childhood poverty represents a substantial cost to neighborhoods, communities and the economy as a whole.
What can be done to narrow the gap in skills and opportunities and help economically disadvantaged youth transition successfully from school into the workforce? Students should be offered a variety of skills development options while still in high school, based on their academic potential and interest. One such opportunity is Career and Technical Education (CTE). The benefits of CTE participation for low-income students are documented in the third tab of the tool.
About the Data
This research uses data on students who graduated from a Minnesota public high school merged with postsecondary student records and Minnesota Unemployment Insurance wage records from the Statewide Longitudinal Education Data System (SLEDS). All students who graduated from high school between 2011 and 2014 are included except individuals who graduated after age 21, those with cognitive or physical disabilities at any time during high school, and those with no employment record in Minnesota after high school.
1 Students are eligible for the Free/Reduced Price Lunch program when their family income is at or below 185 percent of the poverty level ($45,510 for a family of four, as measured in 2017). In the graduation years used for this study (from 2011 to 2014), approximately 4 out of every 10 public school students were eligible for free and reduced-price lunch. Source: https://data.web.health.state.mn.us/lunch-metadata
2 The estimated family sustaining wage of $22.53 per hour needed to cover the cost of a typical family is taken from the Minnesota Cost of Living tool. DEED defines the typical family as a 3-person family with one fulltime worker, one part-time worker, and one child.
3 In our dataset, high math achievers are substantially less likely to earn bachelor's degrees or higher credentials if they come from lower-income families.
4 Filtering the results by race shows that Asian students who exceeded proficiency in 8th grade math reached the same wage in the 11th year as white students. In contrast, Black/African American students who exceeded proficiency in 8th grade math had a much slower wage growth than their Asian and white peers.
5 First-generation is defined as having neither parent with a Bachelor's degree. Among high school graduates in 2023-2024 who enrolled in a Minnesota postsecondary institution, low-income students were significantly more likely than their wealthier peers to be first-generation. Two out of three (68%) Minnesota high school graduates from low-income families were first-generation versus one out of four (26%) of their higher income peers. Source: Author's calculations based on data from SLEDS.