People Moving into Northwest Minnesota Drives Population Growth and Boosts the Labor Force
by Anthony Schaffhauser
October 2024
From 2020 to 2023 Northwest Minnesota's population grew by over 5,900 people or 1%. There are only two ways that the population can grow: (1) Positive net migration and (2) Positive natural change, which is more births than deaths. All Northwest Minnesota's growth is attributable to more people moving into the region than moved out, that is, positive net migration. Unlike births, workers moving into the region immediately grows the labor force. This Spotlight examines the magnitude and labor force impact of this net migration.
Northwest Minnesota's positive net migration overwhelmingly surpasses the negative natural change.
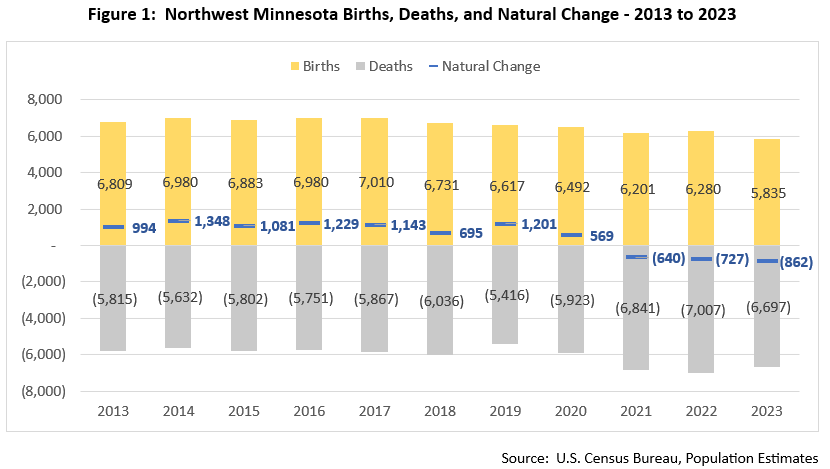
Since 2020 there were about 2,200 more deaths than births in Northwest Minnesota (Figure 1). This negative natural change just began in 2021. Prior to 2021, positive natural change was the norm. Births have been generally trending down since 2017, while a higher number of deaths occurred in 2021 and 2022. While deaths decreased in 2023, the number of deaths and the death rate are still higher than any year from 2013 through 2020. Thus, the switch to negative natural increase is from a combination of fewer births and more deaths, but more so from the increase in deaths. In 2023 there were 657 fewer births and 774 more deaths than in 2020.

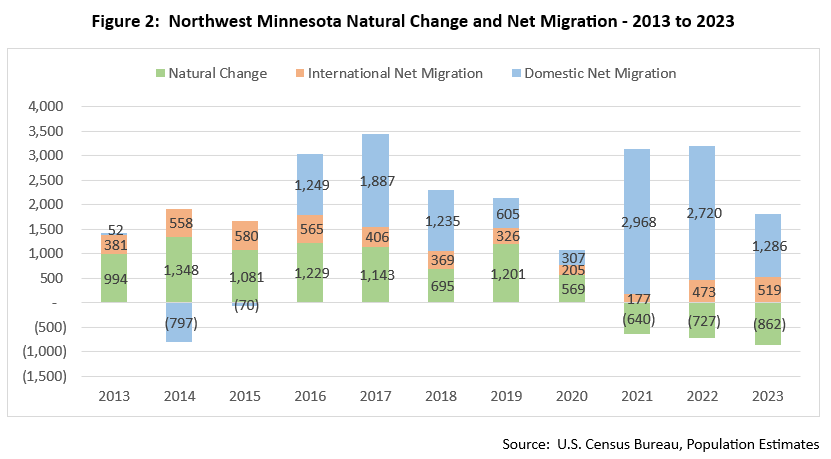
The switch from positive to negative natural increase after 2020 shows prominently in Figure 2's green bars. Figure 2 also displays net migration from moves made within U. S., called domestic net migration, separate from the net migration from moves made to and from the U.S. and foreign countries, called international net migration. Domestic net migration surged to the highest and second highest levels of the decade in 2021 and 2022, and 2017 is the only year that it exceeded the level in 2023. International net migration trended down from 2016, reaching the lowest levels in 2020 and 2021 when COVID-19 restrictions on U.S. visas and entry were in effect. International net migration in 2022, and 2023 returned to levels similar to near 2016 and 2017. Since 2020, the overall gain from domestic and international net migration was about 8,100. That's about 3.8 times more than the loss from negative natural change.

A pandemic-related jump in net migration is not unique to Northwest Minnesota, but it was stronger than average.
Increased net migration to rural counties has been a trend in Minnesota statewide, as well as nationally. This trend started "even before the pandemic and accelerated during it." "Fear of exposure to COVID-19 in metro areas and the subsequent increase in remote work contributed to a major shift in migration patterns." However, the magnitude of the net migration was higher in the Northwest, at least in 2021 and 2022. Table 1 shows net migration as a percent of total population, comparing Northwest to Greater Minnesota. The Northwest's rate of net migration was much higher than Greater Minnesota 2021 and 2022, but it dropped below Greater Minnesota in 2023. Greater Minnesota's rate decreased in 2022, and then increased slightly in 2023. This raises the question of whether Northwest net migration and in turn population growth will slow.
| Table 1:Northwest and Greater Minnesota Net Migration Rates | |||
|---|---|---|---|
| Location | 2021 | 2022 | 2023 |
| Northwest Minnesota | 0.54% | 0.55% | 0.31% |
| Greater Minnesota | 0.45% | 0.36% | 0.39% |
| Source: U.S. Census Bureau, Population Estimates | |||
Growth in work from home has fueled migration of workers seeking rural amenities and lower costs.
People moving for quality-of-life factors, so called "amenity migration," has long been recognized as a draw to rural areas. Natural beauty and outdoor recreation of lakes, forests, and prairielands in Northwest Minnesota have drawn retirees, and now "remote work is allowing more locational freedom for working-age adults."
According to the U.S. Census Bureau American Community Survey 5-year estimates for 2018-2022, 9.2% of Northwest Minnesota workers worked from home, up from 6.2% in the 2013-2017 5-year estimates. Because five years of survey data need to be combined to have sufficient sample survey responses for rural areas, we cannot compare before and after the pandemic until we get the 2020-2025 5-year estimates. However, the uptick in working from home already shows.
Statewide, we have the data to show the number of workers working from home increased from 6.4% in 2019 to 20.9% in 2021. The percent of Minnesota workers working from home dropped back to 17.2% in 2022 and 16.1% in 2023. However, that is still 2.5 times higher than in 2019 prior to the pandemic.
A 2021 survey done by Paulsen marketing company concludes, "if telecommuting is an option, 66% of Americans . . . would consider moving to a rural home or a subdivision." More land and space around a home, more affordable homes, a lower cost of living more generally, fewer people, less traffic, and a safe environment with clean air and water are some reasons cited by survey respondents for moving to a rural area. The Northwest has cost of living advantages. Table 2 compares basic cost of living in Northwest Minnesota to the other five Minnesota Planning Areas. It shows that Northwest has the lowest housing cost and the second lowest yearly cost.
| Table 2: Basic Needs Cost of Living Comparison by Planning Area* | ||||||||
|---|---|---|---|---|---|---|---|---|
| Planning Area | Yearly Cost ($) | Monthly Cost ($) | ||||||
| Child Care | Food | Health Care | Housing | Transport | Other | Taxes | ||
| Northeast Minnesota | 60,228 | 393 | 932 | 576 | 1,073 | 964 | 480 | 601 |
| Southwest Minnesota | 56,004 | 325 | 942 | 576 | 936 | 923 | 449 | 516 |
| Central Minnesota | 65,436 | 431 | 934 | 577 | 1,205 | 1,094 | 512 | 700 |
| Southeast Minnesota | 62,184 | 472 | 940 | 579 | 1,083 | 987 | 484 | 637 |
| Northwest Minnesota | 58,416 | 346 | 938 | 579 | 932 | 1,060 | 448 | 565 |
| Twin Cities | 72,444 | 662 | 970 | 572 | 1,468 | 942 | 584 | 839 |
| *For a family with one child and two adults with one working full-time and one working part-time.
Source: DEED Cost of Living, 2023 |
||||||||
How much does the Northwest's net migration impact the workforce?
If nearly all the net migration is retirees, then there would be little labor force impact. Table 3 estimates the number of people in age groups under age 65 moving into the region using the population estimates by age over the three years from 2020 to 2023. If there is an increase in the number of people three years older from three years in the past, this is from net migration because there is no other cause for the number to increase. Granted, it slightly understates net migration because there is some decrease from deaths, but death rates are very low for ages under 65 years. According to the National Institutes of Health, the 2018 to 2022 death rate for Minnesotans aged 40 to 64 was 0.3%, and 0.1% for aged 20 to 39.
| Table 3: Northwest Minnesota 2020 to 2023 Net Migration Estimates for Age Groups Under 65 Years | |||||
|---|---|---|---|---|---|
| Age in 2020 | 2020 Population | Age in 2023 | 2023 Population | 2020 -2023 Change | |
| Number | Percent | ||||
| -3 to 11* | 105,502 | 0 to 14 | 107,639 | 2,137 | 2.0% |
| 12 to 21 | 75,077 | 15 to 24 | 72,925 | -2,152 | -2.9% |
| 22 to 51 | 190,549 | 25 to 54 | 192,731 | 2,182 | 1.1% |
| 52 to 61 | 77,185 | 55 to 64 | 78,938 | 1,753 | 2.3% |
| Up to 61 | 448,313 | 0 to 64 | 452,233 | 3,920 | 0.9% |
| * Includes births in 2021 to 2023
Source: U.S. Census Bureau, Population Estimates |
|||||
The estimated cumulative net migration of those under age 65 in Table 1 is 3,920. The total net migration for all ages groups is 8,143 from the net migration shown in Figure 2. Thus, about half (52%) of the net migration is in the traditional retirement age of 65 and over. With 2,137 net migrants under age 15 in 2023, that leaves around 1,783 in the age 15 to 64 group, or 22%. However, there were 2,182 net migrants ages 25 to 54, while there was a net loss of 2,152 from those aged 15 to 24 moving away.
That is a net benefit to the Northwest Region's workforce because the labor force participation rate (LFPR) is the highest among those ages 25 to 54. According to the U.S. Census 2018 to 2022 American Community Survey, the ages 25 to 54 LFPR was 87%, compared to for 71% for ages 16 to 24. So even though the Northwest gained only 30 more ages 25 to 54 than it lost in ages 15 to 24, there is a gain of 370 in the labor force from the much higher LFPR of the ages 25 to 54 demographic.
There is also the 1,753 aged 55 to 64 with a 69% LFPR, yielding a 1,210 estimated gain to the labor force. And finally, there are the 4,223 age 65 and older with a LFPR of 23%, providing another 970 workers. Thus, even with only a bit over 20% of the net migration in the traditional working age group, it is still providing a substantial boost to the region's labor force. Based on the LFPRs by age group, some 2,550 workers over three years or about 850 each year.
While a significant portion of these workers that moved to Northwest Minnesota are no doubt working remotely for employers outside the region, the bulk of their wages are spent in the region, thereby increasing regional prosperity. Likewise for retirees who move to Northwest Minnesota. Furthermore, many of the partners and family members of remote workers and retirees will work for employers in the region. Clearly this recent trend of increased net migration is a great benefit to the region.
Summary and Conclusion
From 2020 to 2023 Northwest Minnesota experienced significant population growth due to positive net migration, with over 8,100 more people moving into the region than moving out. This growth in population contrasted with the negative natural change, with more deaths than births over this period. The magnitude of the net migration was higher in Northwest Minnesota compared to Greater Minnesota, likely driven by increased remote work opportunities allowing people to move for quality-of-life factors like the region's natural amenities and lower cost of living.
The recent surge in net migration to Northwest Minnesota has been a significant boon for the region, driving population growth and expanding the available workforce. While some of the working-age migrants are likely remote workers, their spending and the employment of their family members in the local economy still provides economic benefits. With the region's cost of living advantages, it is well-positioned to continue attracting new residents seeking a high quality of life and greater affordability. The rate of net in-migration waned when the pandemic ended. However, "the pandemic only intensified the net migration trends that were already in place. So the question isn't whether migration trends changed because of the pandemic, but rather if the pandemic just sharpened the direction they were already going for a bit and will they ultimately go back to what they were before: a slow-moving upward trend for greater Minnesota..." As long as this trend of positive net migration continues, it will be a major factor supporting the economic vitality and workforce capacity of Northwest Minnesota.

