

Minnesota Short-Term Employment Projections: Industry and Occupational Outlook, Q2 2025–Q2 2027

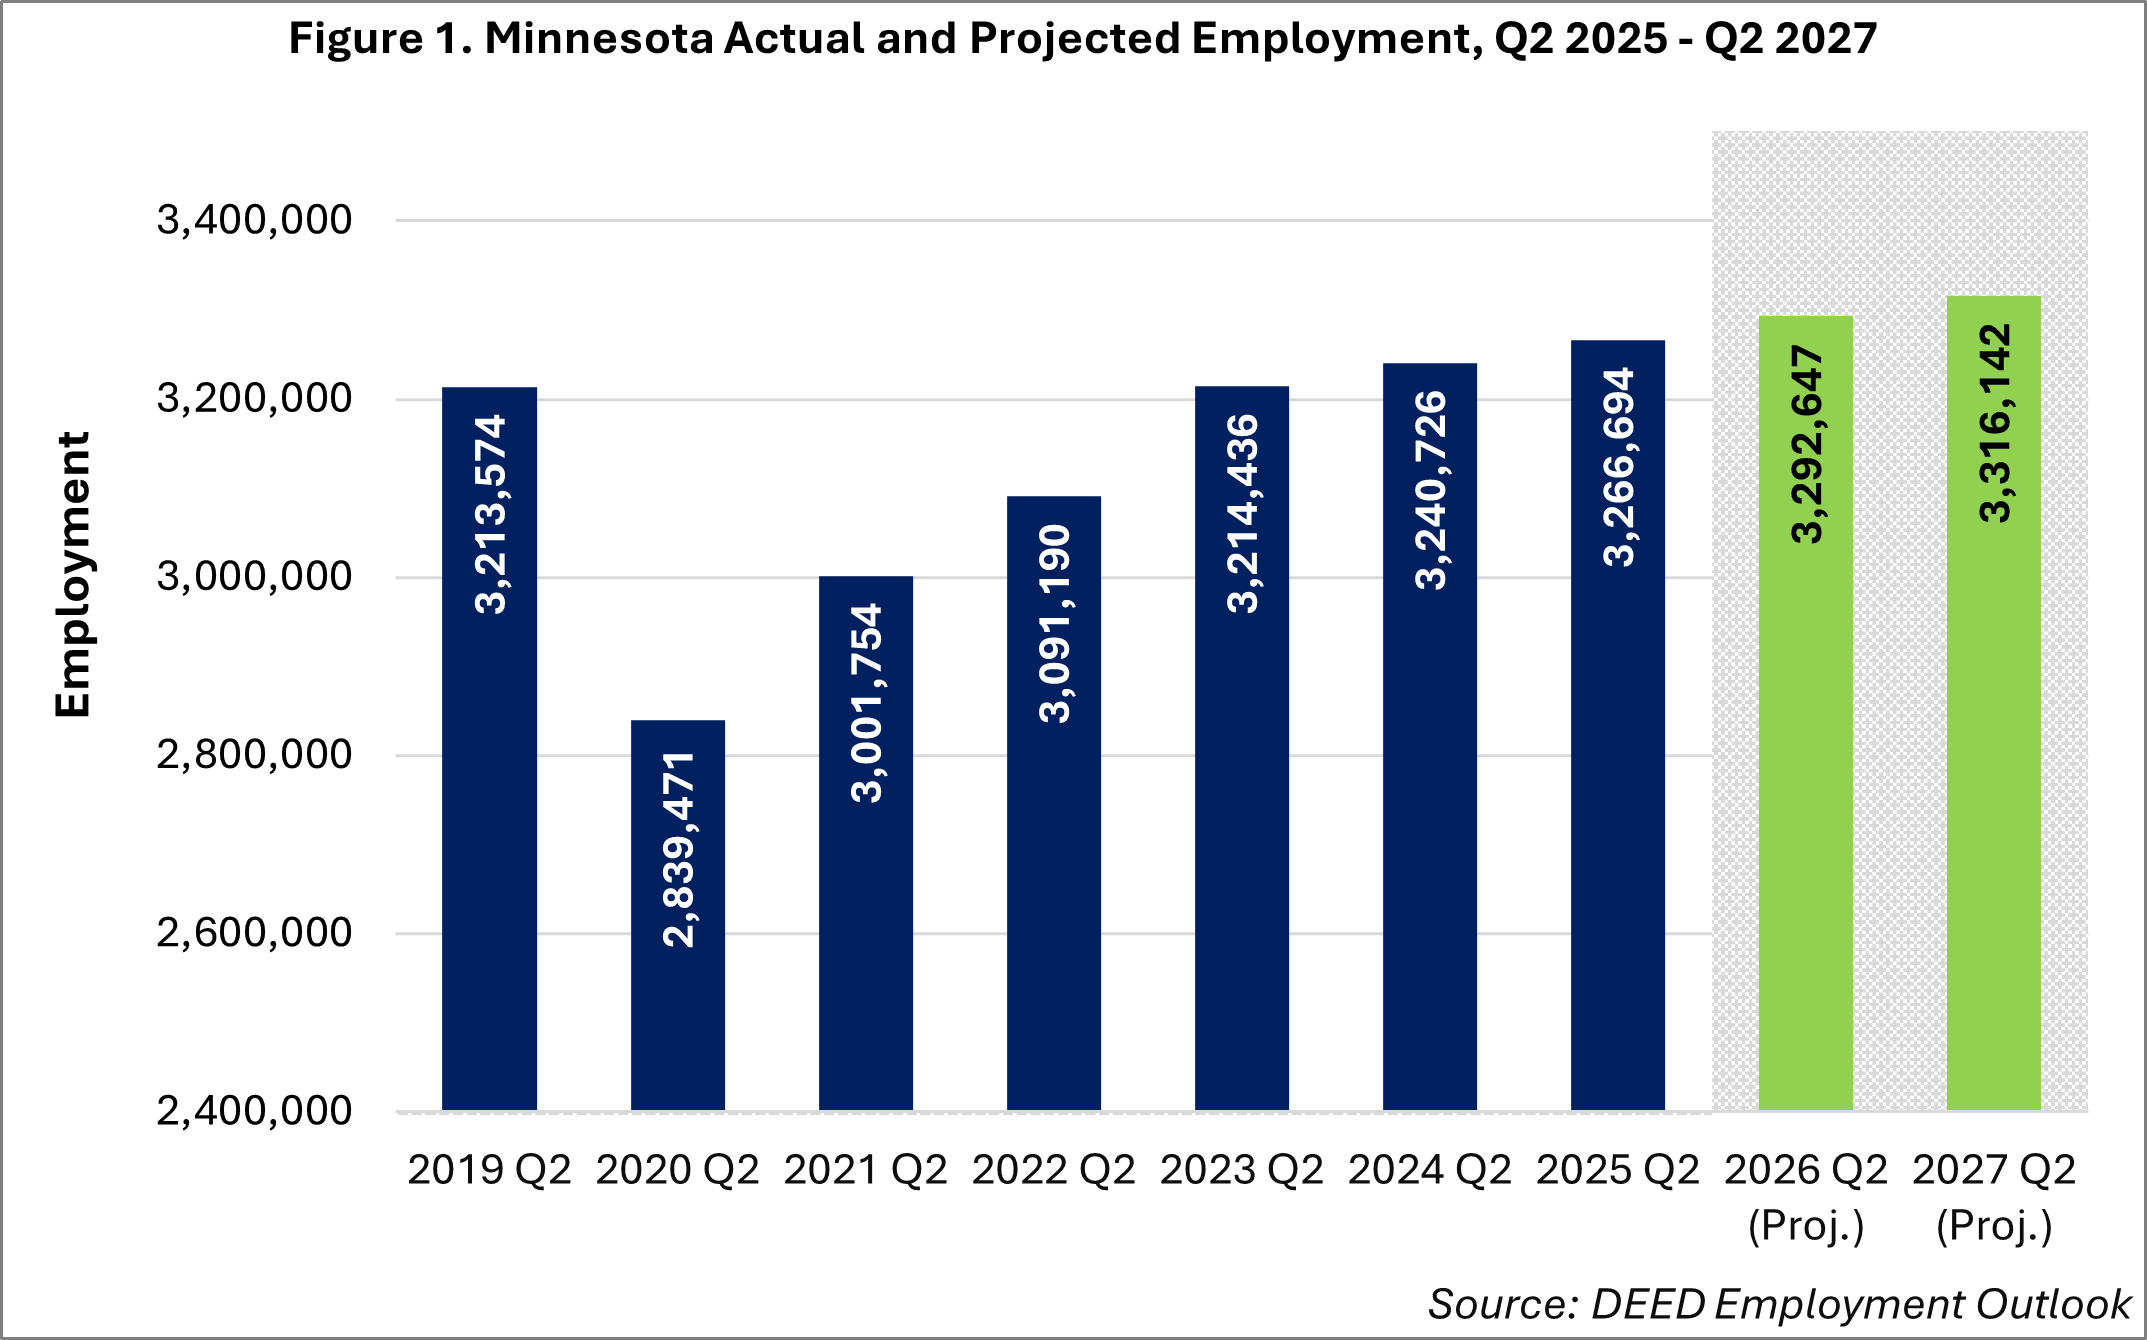
Minnesota's short-term employment projections indicate continued steady growth, with an estimated 50,000 jobs expected to be added between the second quarters of 2025 and 2027. (see Figure 1).
These projections show a 1.5% increase over the two-year period, roughly equivalent with the last two years of employment growth in Minnesota. From 2nd quarter 2023 to second quarter 2025, Minnesota's economy added 52,300 jobs across all industries, equaling a percent change of +1.6%.
In a rapidly changing economy, it remains important to plan for the future. To that end, DEED produces both 2-year and 10-year employment projections to address the short-term and long-term outlooks. These projections can be useful estimates of demand for workers across industries and occupations in Minnesota.
Industry Trends
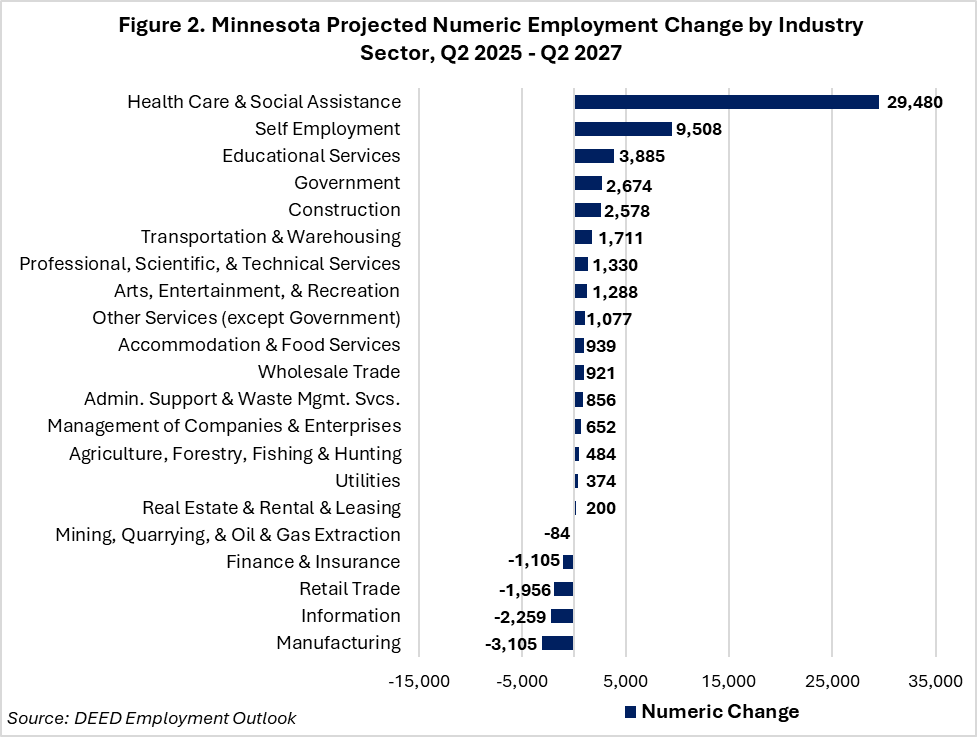
As it has in the past, Health Care & Social Assistance is expected to continue driving near-term growth in the state, with an estimate of 29,480 jobs added (see Figure 2). At that level, the sector is forecasted to account for half of gross jobs gained in the state. After that, Self-Employment, Educational Services, Government and Construction combined are projected to add an additional 18,600 jobs to the state economy, which is another one-third of the total projected growth.
Health Care & Social Assistance (+5.3%) and Self-Employment (+4.4%) are also projected to see the fastest employment growth, in addition to the largest number of jobs added. Now well removed from the pandemic, the rate of employment growth in Health Care and Social Assistance in 2024 and 2025 was the highest it has been dating back to 2006. And while employment growth is expected to slow slightly in the next two years, it remains the highest among all sectors.
Self-employment has been more volatile in the long term, but growth in nine out of ten quarters leading up to the projection period indicates expansion is likely to continue. This includes growth in areas like Transportation, Arts, Entertainment and Recreation, Health Care and Social Assistance, and Educational Services.
At the industry level, above average percent growth is also expected for Utilities (+2.5%), Arts, Entertainment, and Recreation (+2.2%), Agriculture, Forestry, Fishing, and Hunting (+2.0%), Construction (+1.7%) and Educational Services (+1.6%).
In contrast, five sectors are expected to see employment declines over the next biennium. The largest numeric losses are projected for Manufacturing, Information, Retail Trade and Finance and Insurance. After weathering and even expanding during the COVID-19 recession, the Manufacturing sector saw employment declines more recently. Manufacturing, along with Retail Trade, continue to face supply chain and consumer demand uncertainty as well as disruption from technological change and evolving market conditions. The Information sector, which includes newspapers and periodicals, is expected to continue its long-term decline, as is Finance and Insurance, which has lost jobs since peaking in 2019.
Occupational Trends
Though there is expected to be steady growth in new jobs created, turnover is the primary driver of estimated future demand for labor. Numeric change represents the estimated net employment change (new jobs added or lost) . Most future job openings are created via workers leaving one occupation for another (transfers) or leaving the labor market altogether (exits).
Classified as labor market exit openings, these existing jobs still need to be filled as those workers need to be replaced. In sum, our projections show that as many as 315,000 existing workers may retire or leave the labor market over the next two years. An additional 385,000 openings are expected to come from workers changing jobs. Combined, transfer and exit openings are expected to account for 93% of total openings (see Table 1).
The two Healthcare occupational groups are expected to continue to lead numeric change, yet total openings are expected to be highest in the large Food Preparation and Serving Related and Office and Administrative Support groups due to transfer and exit openings. In fact, despite projected net employment declines over the next two years, Office and Administrative Support and Sales and Related occupations are predicted to be areas of considerable demand. Production is the only other occupational group expected to see a net employment decline, resulting from many of the same challenges as described for the closely related Manufacturing sector, but will still have over 40,000 total openings.
| Table 1. Minnesota Projected Numeric and Percent Employment Change by Occupational Group, Q2 2025- Q2 2027 | |||||
|---|---|---|---|---|---|
| Occupational Group | Percent Change | Numeric Change | Labor Market Exit Openings | Transfer Openings | Total Openings |
| Total, All Occupations | +1.5% | +49,448 | 314,630 | 384,898 | 748,976 |
| Food Preparation and Serving Related | +0.6% | +1,580 | 40,243 | 50,450 | 92,273 |
| Office and Administrative Support | -0.4% | -1,515 | 37,932 | 42,134 | 78,551 |
| Healthcare Support | +6.9% | +13,735 | 31,957 | 26,864 | 72,556 |
| Sales and Related | -0.5% | -1,243 | 31,057 | 36,522 | 66,336 |
| Transportation and Material Moving | +1.5% | +3,604 | 26,818 | 33,231 | 63,653 |
| Management | +2.0% | +5,011 | 14,559 | 23,938 | 43,508 |
| Production | -0.7% | -1,487 | 18,111 | 26,259 | 42,883 |
| Educational Instruction and Library | +1.9% | +3,601 | 17,711 | 18,136 | 39,448 |
| Business and Financial Operations | +1.0% | +2,264 | 13,329 | 20,394 | 35,987 |
| Personal Care and Service | +2.6% | +2,382 | 12,456 | 17,975 | 32,813 |
| Building & Grounds Cleaning & Maintenance | +2.0% | +2,067 | 13,563 | 14,823 | 30,453 |
| Healthcare Practitioners and Technical | +3.8% | +7,659 | 11,739 | 10,092 | 29,490 |
| Construction and Extraction | +2.3% | +3,415 | 9,324 | 13,768 | 26,507 |
| Installation, Maintenance, and Repair | +1.2% | +1,417 | 8,916 | 11,454 | 21,787 |
| Community and Social Service | +4.0% | +3,028 | 6,475 | 7,629 | 17,132 |
| Protective Service | +1.2% | +629 | 4,513 | 6,374 | 11,516 |
| Computer and Mathematical | +0.3% | +327 | 3,996 | 6,313 | 10,636 |
| Arts, Design, Entertainment, Sports, & Media | +1.1% | +600 | 4,314 | 5,685 | 10,599 |
| Architecture and Engineering | +1.7% | +978 | 3,040 | 4,633 | 8,651 |
| Life, Physical, and Social Science | +2.5% | +839 | 1,326 | 4,035 | 6,200 |
| Farming, Fishing, and Forestry | +1.6% | +253 | 2,173 | 2,622 | 5,048 |
| Legal | +1.3% | +304 | 1,078 | 1,567 | 2,949 |
| Source: DEED Employment Outlook | |||||
Both Healthcare occupational groups as well as Community and Social Service and Personal Care and Service are expected to see the fastest percent growth, reflecting continued strong demand for health, human, and personal services. Following those care-centric professions, above-average percent change is also projected for occupational groups connected to the trades and facilities management such as Construction and Extraction, Architecture and Engineering, and Building and Grounds Cleaning and Maintenance. Educational, Management, and Farming, Fishing and Forestry positions also show near-term growth that is above the state average.
Notably, Computer and Mathematical occupations are projected to see near-flat growth (+0.3%), a finding that may reflect current market saturation in technology hiring following the sector's rapid post-pandemic expansion, or the early displacement effects of AI tools on certain technical roles. This trend warrants continued monitoring.
Educational Trends
Breaking up employment by the typical education required provides another look into expected trends. Occupations that typically require a high school diploma or equivalent or a bachelor's degree are projected to add the most net new jobs but are some of the slower growing groups (see Figure 3).
Occupations requiring advanced degrees are projected to grow the fastest, especially jobs like Therapists, Nurse Practitioners, Chiropractors, Physicians Assistants and many other healthcare practitioners. These trends reflect the projected high growth within the Health Care industry, a field that depends on a highly-trained workforce. The slower growth among jobs requiring a high school education or below indicates continued availability, but also displays the value of postsecondary education and training in the state.

Short term employment projections help a wide range of stakeholders make smarter, more timely decisions in a rapidly changing labor market. By highlighting which industries and occupations are expected to grow over the next couple of years, these projections guide students toward programs that lead to strong job prospects, help job seekers target careers where openings are likely, and support job counselors as they align individuals' skills and interests with real labor market demand.
Educational institutions can also use these insights to update curricula, expand high growth training programs, and ensure that their offerings remain relevant. In a tight labor market where matching people to available jobs is especially critical, short term projections strengthen the overall alignment between workforce preparation and employer needs.
For more information – including by individual occupation and detailed industry – visit DEED's Employment Outlook page.