The Evolving Demographics of Southwest Minnesota: Past, Present, and Future
by Amanda O'Connell and Luke Greiner
September 2024
Population changes are occurring throughout Minnesota with some areas experiencing growth while others face declines. Southwest Minnesota is no exception to these demographic shifts, as the region undergoes changes in its population size, age distribution, and racial and ethnic composition. This article explores the evolution of Southwest Minnesota's population over time, examines its current state and looks at projections for the future. By analyzing these trends, we can better anticipate and prepare for the challenges and opportunities in Southwest Minnesota.
From Farming Crisis to Present Day
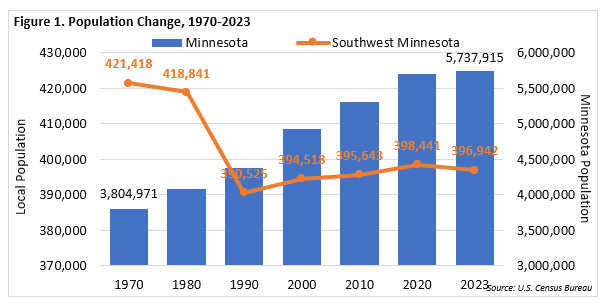
The period from 1980 to 1990 saw a notable decline, with the region losing 28,316 residents – a 6.8% decrease largely attributed to the farm crisis (Figure 1). The 1970s had been a thriving time for agriculture in the area, with booming farm activity. Many farmers, encouraged by this success, took out substantial loans to expand their operations, purchasing additional land and equipment. However, the 1980s brought a severe economic downturn to the agricultural sector. This crisis was characterized by a sharp decline in exports and land values, coupled with rising production costs and interest rates on loans.

These factors created a perfect storm for the farming community. Unable to meet their loan obligations, many farmers faced foreclosures and bankruptcies. The impact was substantial: the number of farms in the region fell from 98,671 in 1978 to 85,079 in 1987—a loss of over 13,000 farms in less than a decade. This agricultural downturn had a ripple effect on the entire region. With fewer farms and limited job opportunities in other sectors, many residents were forced to leave Southwest Minnesota in search of work elsewhere, contributing significantly to the area's population decline1.
| Table 1. Population Changes, 2020-2023 | |||
| Geography | 2023 Population | 2020-2023 | |
| Numeric | Percent | ||
| EDR 6W | 43,093 | -756 | -1.7% |
| EDR 8 | 116,046 | -1,391 | -1.2% |
| EDR 9 | 237,803 | 648 | 0.3% |
| Southwest MN | 396,942 | -1,499 | -0.4% |
| Source: U.S. Census Bureau | |||
Then from 1990 to 2020 the region slowly gained about 8,000 residents, rising to just under 400,000 people in 2020. This was about 4,000 people in the 1990s, then only 1,000 in the 2000s, then about 3,000 in the 2010s.
More recently, from 2020 to 2023, Southwest Minnesota experienced a population decrease of 1,499 people, representing a 0.4% reduction (see Table 1). This recent decline can be examined through vital events and net migration. As shown in Table 2, the region saw a barely positive natural increase, with births (14,372) outnumbering deaths (14,277) by only 95. This minimal natural growth was insufficient to counterbalance the significant net out-migration. While the region gained 2,146 residents through international in-migration, it lost a net of 4,028 residents to domestic out-migration, resulting in a net migration loss of 1,882 people.
| Table 2. Cumulative Estimates of the Components of Population Change, 2020-2023 | |||||||
|---|---|---|---|---|---|---|---|
| - | Total Population Change | April 1, 2020 to July 1, 2023 | |||||
| Natural Increase | Vital Events | Net Migration | |||||
| Births | Deaths | Total | International | Domestic | |||
| EDR 6W | -752 | -222 | 1,632 | 1,854 | -516 | 216 | -732 |
| EDR 8 | -1,619 | 167 | 4,632 | 4,465 | -1,827 | 806 | -2,633 |
| EDR 9 | 657 | 150 | 8,108 | 7,958 | 461 | 1,124 | -663 |
| Southwest MN | -1,714 | 95 | 14,372 | 14,277 | -1,882 | 2,146 | -4,028 |
| Minnesota | 31,111 | 40,368 | 207,857 | 167,489 | -11,352 | 34,624 | -45,976 |
| Source: U.S. Census Bureau, Population Estimates Program | |||||||
These trends, however, are not uniform across Southwest Minnesota's three Economic Development Regions (EDRs). EDR 9, the most populous at 237,803 people, was the only EDR to experience population growth, gaining 648 residents (0.3% increase) from 2020 to 2023. This growth was supported by both a positive natural increase (150) and net in-migration (461).
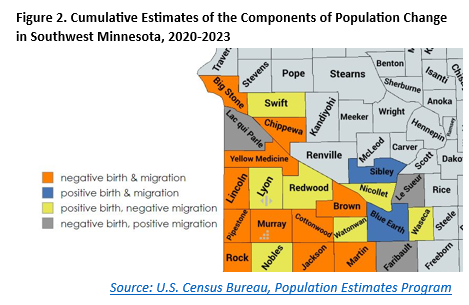
 In contrast, EDR 8, the second largest with 116,046 people in 2023, lost about 1,391 people (1.2%) since 2020. Despite a positive natural increase of 167 more births than deaths, EDR 8 suffered from significant net out-migration (1,827), driving its overall population decline. EDR 6W, the smallest in terms of population, faced the highest percentage decline. It lost 756 people or a 1.7%, reaching 43,093 in 2023. Unlike the other EDRs, 6W experienced both a natural decrease (222) with more deaths than births, and net out-migration (516) compounding its population loss. Overall, only two counties in Southwest Minnesota experienced positive birth and migration from 2020 to 2023: Blue Earth and Sibley (Figure 2).
Comparing population changes across Minnesota's planning regions from 2020 to 2023 reveals notable trends, particularly in Southwest Minnesota. This region experienced the highest percentage decline at 0.4%, and recorded the second-highest numeric decrease, losing 1,499 residents. The Twin Cities Metro Area saw the largest numeric decrease, with 2,628 fewer people (Table 3).
| Table 3. Population Change by Planning Region, 2020-2023 | |||
|---|---|---|---|
| Planning Region | 2023 Population | 2020-2023 | |
| Numeric | Percent | ||
| Central MN | 750,312 | 24,372 | 3.4% |
| Northwest MN | 581,777 | 6,336 | 1.1% |
| Southeast MN | 521,357 | 3,505 | 0.7% |
| Northeast MN | 327,051 | 1,335 | 0.4% |
| Twin Cities Metro | 3,160,476 | -2,628 | -0.1% |
| Southwest MN | 396,942 | -1,499 | -0.4% |
| Minnesota | 5,737,915 | 31,421 | 0.6% |
| Source: U.S. Census Bureau | |||
The comparison between Southwest Minnesota and the Twin Cities Metro Area is particularly interesting given their vastly different population sizes. The Twin Cities Metro Area, with approximately 3.16 million residents, is nearly eight times larger than Southwest Minnesota's population of about 397,000. Yet Southwest Minnesota's population loss was only 1,129 people fewer than that of the much larger metro area.
This disproportionate population change in Southwest Minnesota has various implications for the region. Economically, changes in population can affect the available workforce, which in turn may influence business attraction and retention. The dynamics of providing public services and maintaining infrastructure also shift as population numbers change.
Demographics and Future Projections
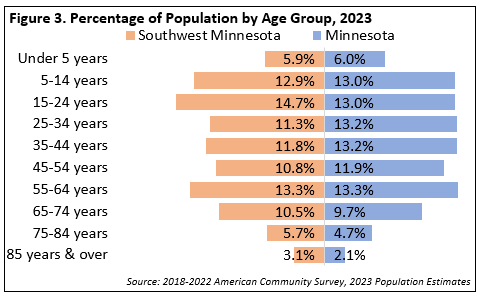
 The demographic makeup of a region significantly influences its social and economic conditions. In Southwest Minnesota the age distribution reveals some notable differences compared to the state of Minnesota as a whole (Figure 3). Southwest Minnesota has a higher percentage of residents aged 15-24 years (14.7% compared to 13.0%) and those aged 65 years and over. Conversely, it has a lower percentage of residents in the 25-54 year old age range, which impacts workforce availability.
Recent population projections from the Minnesota State Demographic Center for Southwest Minnesota from 2025 to 2045 suggest that ongoing shifts in age demographics will persist. The most striking change is anticipated in the older age brackets, with the population aged 75 years and over projected to increase substantially. Specifically, the 85 and older group is expected to grow by a remarkable 38.4%, while the 75-84 age group is anticipated to increase by 13.2% (see Table 4).
| Table 4. Southwest Minnesota Population Projections | 2025-2045 Change | ||||
|---|---|---|---|---|---|
| - | 2025 Projection | 2035 Projection | 2045 Projection | Numeric | Percent |
| Under 5 years | 23,237 | 23,397 | 23,319 | 82 | 0.4% |
| 5-14 years | 50,136 | 48,685 | 48,517 | -1,619 | -3.2% |
| 15-24 years | 60,965 | 62,065 | 60,304 | -661 | -1.1% |
| 25-34 years | 43,886 | 46,454 | 46,111 | 2,225 | 5.1% |
| 35-44 years | 47,362 | 45,469 | 47,642 | 280 | 0.6% |
| 45-54 years | 43,666 | 48,616 | 46,265 | 2,599 | 6.0% |
| 55-64 years | 47,009 | 42,990 | 47,527 | 518 | 1.1% |
| 65-74 years | 45,955 | 40,910 | 37,354 | -8,601 | -18.7% |
| 75-84 years | 26,058 | 33,609 | 29,506 | 3,448 | 13.2% |
| 85 years & over | 11,806 | 13,157 | 16,335 | 4,529 | 38.4% |
| Total | 400,080 | 405,352 | 402,880 | 2,800 | 0.7% |
| Source: Minnesota State Demographic Center | |||||
On a more positive note, the 25-34 and 45-54 age groups are projected to grow by 5.1% and 6.0%, respectively. This growth in working-age populations could help support economic development and workforce sustainability in Southwest Minnesota. The increase in these age groups may partially offset the challenges posed by declines in other working-age brackets.
Racial Projections
Southwest Minnesota has undergone significant demographic shifts between 2011 and 2022, revealing a trend towards increased diversity. While the total population of the region grew modestly by 0.9% (3,439 people), the racial and ethnic composition evolved considerably.
The white alone population, although still the vast majority at 88.5%, decreased by 5%, giving way to growth in various race groups. Southwest Minnesota's Black, Indigenous and People of Color populations saw significant growth from 2011 to 2022. People of Two or More Races experienced the most dramatic change, surging by 207% with an addition of 10,962 individuals. People identifying as Some Other Race group followed, growing by 106.5% or 5,855 people. Hispanic or Latino population also expanded notably, increasing by 48.6% or 9,843 individuals, outpacing Minnesota. These three groups added 26,660 people to the region, significantly diversifying Southwest Minnesota's traditionally white-majority demographic.
| Table 5. Percent of Population by Race & Hispanic Origin, 2022 | EDR 6W | EDR 8 | EDR 9 | Southwest |
|---|---|---|---|---|
| White | 90.8% | 84.6% | 90.0% | 88.5% |
| Black or African American | 0.8% | 2.2% | 2.2% | 2.1% |
| American Indian & Alaska Native | 1.2% | 1.1% | 0.3% | 0.6% |
| Asian & Other Pac. Islander | 1.3% | 3.2% | 1.3% | 1.9% |
| Some Other Race | 2.9% | 4.1% | 2.3% | 2.9% |
| Two or More Races | 3.1% | 4.8% | 3.9% | 4.1% |
| Hispanic or Latino origin | 5.4% | 10.4% | 6.6% | 7.6% |
| Source: U.S. Census Bureau, 2018-2022 American Community Survey | ||||
According to the Minnesota State Demographic Center, EDR 8 and 9 are projected to see significant population growth for people of other races from 2025 to 2045. Native Hawaiian and Pacific Islander populations, though small in number, are projected to nearly double in size from 2025 to 2045. The Black or African American community is set for rapid expansion, particularly in EDR 9 with a projected 79% increase.
People of Two or More Races will also likely see substantial growth, especially in EDR 9 with a 67.8% increase. Hispanic or Latino populations are projected to have the largest numeric increase in both regions. Other race groups, including Asian, American Indian, and Alaska Native populations, are also expected to grow. These projections indicate Southwest Minnesota will become notably more diverse over the next two decades (see Table 6).
| Table 6. Southwest Minnesota Projections by Race & Ethnicity, 2025-2045 | ||||
|---|---|---|---|---|
| EDR 8 | ||||
| Race/Ethnicity | 2025 | 2045 | Numeric Change | Percent Change |
| White | 91,347 | 75,593 | -15,754 | -17.2% |
| Black or African American | 2,826 | 3,875 | 1,049 | 37.1% |
| American Indian & Alaska Native | 1,226 | 1,422 | 196 | 16.0% |
| Asian | 4,546 | 6,073 | 1,527 | 33.6% |
| Native Hawaiian and Pacific Islander | 162 | 315 | 153 | 94.4% |
| Two or More Races | 1,921 | 2,610 | 689 | 35.9% |
| Hispanic or Latino origin | 14,101 | 19,585 | 5,484 | 38.9% |
| EDR 9 | ||||
| Race/Ethnicity | 2025 | 2045 | Numeric Change | Percent Change |
| White | 206,586 | 195,347 | -11,239 | -5.4% |
| Black or African American | 7,083 | 12,682 | 5,599 | 79.0% |
| American Indian & Alaska Native | 922 | 1,347 | 425 | 6.1% |
| Asian | 3,499 | 4,785 | 1,286 | 36.8% |
| Native Hawaiian and Pacific Islander | 156 | 332 | 176 | 112.8% |
| Two or More Races | 4,048 | 6,794 | 2,746 | 67.8% |
| Hispanic or Latino origin | 17,836 | 27,355 | 9,519 | 53.4% |
| Source: Minnesota State Demographic Center
*Projections not available for EDR 6W |
||||
Southwest Minnesota is undergoing significant demographic changes that will shape its future. Despite overall population decline and an aging trend, the region is becoming more racially and ethnically diverse. Projections indicate substantial growth, especially among Hispanic or Latino, Black or African American, and multiracial groups. These shifts will likely impact the region's workforce, economy, and community services. As Southwest Minnesota evolves, considering these demographic changes will be crucial for effective long-term planning and decision-making.

