The Same Old Story? Labor Market Trends in the Metro Area

by Tim O'Neill
June 2025
As we head into the second half of 2025, the seven-county Twin Cities Metro Area's labor market is experiencing two seemingly incompatible trends: it's both rapidly changing and remaining largely stable. These trends are occurring for three major parts of the region's labor market: the labor force, industry employment and hiring demand. Recent data releases from Local Area Unemployment Statistics (LAUS), Quarterly Census of Employment and Wages (QCEW) and Job Vacancy Survey (JVS) will be analyzed to more fully understand the Metro Area's current labor market conditions and trends.
Labor Force Trends in the Metro Area
First, let's focus on labor force. According to the Bureau of Labor Statistics (BLS), the labor force includes all persons 16 years of age and older who are classified as either employed or unemployed. As an annual average in 2024, the Metro Area had nearly 1,762,500 workers. As such, the Metro Area accounts for over half (56.3%) of Minnesota's total labor force of just over 3.1 million workers. Broken down, an average of just over 1,713,000 people in the region were employed and just over 49,400 people were unemployed over the course of 2024.
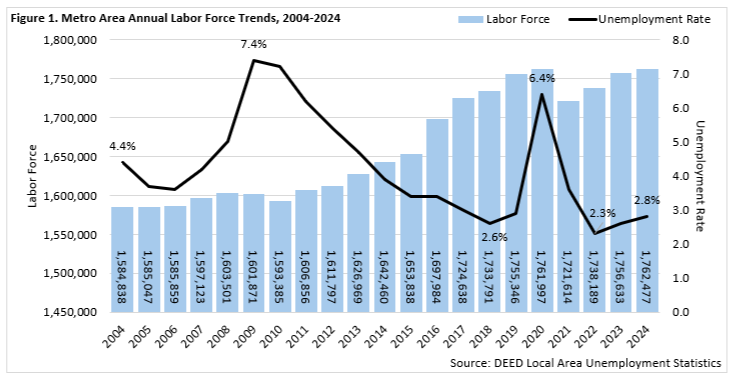
The Metro Area's labor force grew by just over 5,800 people between 2023 and 2024. While this annual growth rate of 0.3% lagged behind the respective statewide growth rate of 0.7%, the Metro Area's total labor force size just surpassed its previous annual peak in 2020. It should be noted that the region's labor force growth in recent years has slowed significantly from previous decades. More specifically, the region's annual labor force growth averaged 1.6% (+21,800 persons per year) during the 1990s. This slowed to an annual rate of 0.2% (+3,000 persons per year) during the 2000s, which included the Great Recession. Annual average labor force growth rebounded to 1.1% (+16,900 persons per year) during the 2010s, but has since slowed to an annual rate of 0.0% in the 2020s. This slower growth is largely due to the 2.3% drop between 2020 and 2021, a loss of nearly 40,400 persons during the COVID pandemic (Figure 1).
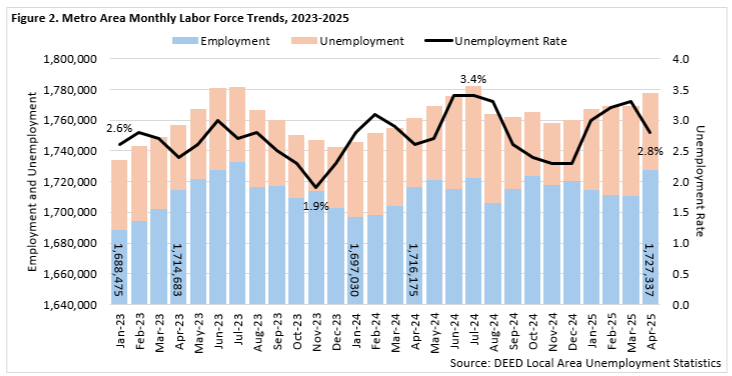
The Metro Area's annual unemployment rate, after hitting a record low of 2.3% in 2022, has risen in each of the past two years to 2.8%. Analyzing monthly trends, the unemployment rate sank to 1.9% in November 2023. By June of the following year, the unemployment rate had reached its highest level in over 30 months, at 3.4%. The monthly unemployment rate has since alternated back and forth between 2.3% and 3.3%, with the total number of unemployed persons hovering between 40,000 persons in December 2024 and 58,500 unemployed persons in March 2025 (Figure 2).
Zooming in, annual unemployment in the Metro Area for 2024 ranged from 2.6% in Carver County to 3.0% in Anoka County. As the two largest counties, nearly three-fifths of the region's total labor force and unemployed persons were in Hennepin and Ramsey counties (Table 1).
Interestingly, these were also the region's two counties to witness labor force declines between 2019 and 2024. During that period, Hennepin County's labor force size dropped by 1.3%, which was equivalent to nearly 9,500 fewer people. Ramsey County's labor force size dropped by 3.0%, which was equivalent to a loss of just over 8,800 workers. Despite the combined loss of nearly 18,300 people, the Metro Area's total labor force size was bolstered by significant growth in the remaining five counties. Washington County's labor force witnessed the largest and fastest growth during this period, adding about 7,300 people (+5.1%).
| Table 1. Metro Area Labor Force Statistics, Annual 2024 | |||||
|---|---|---|---|---|---|
| Area | Labor Force Size | 2019-2024 Labor Force Change | Number of Unemployed | Unemployment Rate | |
| Numeric | Percent | ||||
| Metro Area | 1,762,477 | +7,131 | +0.4% | 49,437 | 2.8% |
| Hennepin County | 716,187 | -9,459 | -1.3% | 19,887 | 2.8% |
| Ramsey County | 287,815 | -8,805 | -3.0% | 8,465 | 2.9% |
| Dakota County | 249,927 | +5,485 | +2.2% | 6,867 | 2.7% |
| Anoka County | 204,770 | +5,986 | +3.0% | 6,182 | 3.0% |
| Washington County | 150,237 | +7,297 | +5.1% | 3,996 | 2.7% |
| Scott County | 90,354 | +3,672 | +4.2% | 2,412 | 2.7% |
| Carver County | 63,187 | +2,955 | +4.9% | 1,628 | 2.6% |
| Minnesota | 3,129,802 | +18,129 | +0.6% | 94,296 | 3.0% |
| United States | 168,106,166 | +4,567,500 | +2.8% | 6,760,750 | 4.0% |
| Source: DEED Local Area Unemployment Statistics | |||||
Industry Trends in the Metro Area
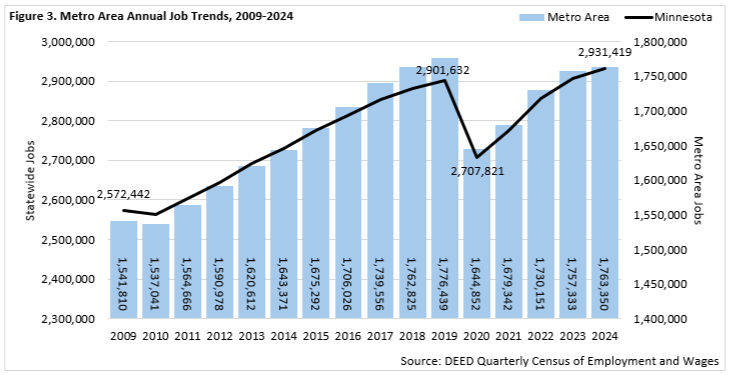
The change in the Metro Area's total employment over the past five years generally mirrors the changes witnessed in its labor force. During the COVID-19 recession, between 2019 and 2020, the region's total employment dropped by nearly 131,600 jobs. This 7.4% decline was slightly more severe than Minnesota's total 6.7% drop in employment during that period. While the Metro Area's labor force size has fully recovered from losses experienced during COVID, total employment in the region is not quite there yet. Between 2020 and 2024, the region's total employment increased by just under 118,500 jobs. As such, it still has about 13,100 jobs to go to match its 2019 annual level of employment. For reference, Minnesota's total employment in 2024 is about 29,800 jobs above its respective 2019 annual level of employment (Figure 3).
Also like its labor force trends, the Metro Area's net employment loss between 2019 and 2024 was largely dominated by losses in Hennepin and Ramsey counties. During that period, Hennepin County's total employment was down by 2.3%, or just over 21,300 jobs. Ramsey County's total employment was down by 3.0%, or about 10,200 jobs. Dakota County was also down a slight 1.3%, or about 2,400 jobs, between 2019 and 2024. Where Hennepin and Ramsey counties had the largest of Minnesota's employment losses by county between 2019 and 2024, Scott, Washington and Anoka counties took the top three spots for employment gains. Carver County just managed to surpass its 2019 annual level of employment this year, up by 0.6% between 2019 and 2024 (Table 2).
| Table 2. Metro Area Industry Statistics and Trends by County, Annual 2024 | ||||||
|---|---|---|---|---|---|---|
| Area | Number of Jobs | Number of Establishments | Total Payroll ($1,000s) | Avg. Annual Wage | 2019 – 2024 Job Change | |
| Numeric | Percent | |||||
| Hennepin County | 916,429 | 44,751 | $82,645,492 | $90,220 | -21,339 | -2.3% |
| Ramsey County | 325,203 | 15,433 | $25,340,141 | $77,948 | -10,163 | -3.0% |
| Dakota County | 189,051 | 11,921 | $13,765,949 | $72,852 | -2,448 | -1.3% |
| Anoka County | 133,140 | 8,841 | $8,683,705 | $65,208 | +5,177 | +4.0% |
| Washington County | 95,582 | 7,000 | $5,802,699 | $60,684 | +7,139 | +8.1% |
| Scott County | 63,103 | 3,990 | $3,921,204 | $62,088 | +8,292 | +15.1% |
| Carver County | 40,840 | 2,869 | $2,754,668 | $67,496 | +253 | +0.6% |
| Metro Area | 1,763,350 | 94,804 | $142,913,859 | $81,068 | -13,089 | -0.7% |
| Minnesota | 2,931,419 | 212,756 | $217,596,492 | $74,256 | +29,787 | +1.0% |
| Source: DEED Quarterly Census of Employment & Wages (QCEW) | ||||||
While the Metro Area's post-COVID employment recovery is slightly behind the state overall, there is no arguing on the importance of the region to Minnesota's economy and industry employment. In 2024, the Metro Area had an annual average of 94,804 establishments supplying 1,763,350 covered jobs. As such, the region accounts for three-fifths (60.2%) of the state's total employment.
Total payroll across all industries equaled $142.9 billion, with an average annual wage equal to $81,068. This average wage was 9.2% higher than the state's annual average wage of $74,256. Average wages for the Metro Area were especially high in Mining ($152,308); Finance & Insurance ($150,228); Management of Companies ($149,032); Utilities ($137,384); Professional, Scientific & Technical Services ($126,724); Information ($120,276); and Wholesale Trade ($109,252) (Table 3).
Health Care & Social Assistance is the Metro Area's largest employing industry sector. In fact, over one-in-six jobs (17.3%) in the region are in this industry. Accounting for nearly one-in-ten jobs (9.8%), Manufacturing is the second largest employing and one of the highest paying industries in the region. Rounding out the top three is Retail Trade, with over 155,400 jobs at 8,398 establishments. Together, these three industries account for more than one-third (35.9%) of the Metro Area's total employment. Other sectors with more than 100,000 jobs include Educational Services; Accommodation & Food Services; and Professional, Scientific & Technical Services.
With about 74,200 jobs at 1,069 establishments, Management of Companies is the Metro Area's 13th largest employing industry sector. While high-employing and high-paying, this industry is truly unique to the region. In 2024, 85.6% of Minnesota's total employment in Management of Companies was located right in the Metro Area. Other industries with high shares of the state's total employment in the region include Real Estate, Rental & Leasing (75.5%); Professional, Scientific & Technical Services (74.2%); and Finance & Insurance (72.0%).
| Table 3. Metro Area Industry Statistics, Annual 2024 Sorted by Number of Jobs | |||||
|---|---|---|---|---|---|
| Industry | Number of Establishments | Number of Jobs | Share of MN Jobs | Total Payroll ($1,000s) | Avg. Annual Wage |
| Total, All Industries | 94,804 | 1,763,350 | 60.2% | $142,913,859 | $81,068 |
| Health Care & Social Assistance | 14,721 | 304,298 | 57.1% | $20,157,325 | $66,196 |
| Manufacturing | 3,989 | 172,772 | 53.9% | $16,164,650 | $93,548 |
| Retail Trade | 8,398 | 155,422 | 54.5% | $6,540,209 | $42,068 |
| Educational Services | 2,438 | 137,859 | 58.8% | $9,263,240 | $67,028 |
| Accommodation & Food Services | 6,575 | 134,980 | 58.8% | $4,074,409 | $30,160 |
| Professional, Scientific, & Technical Services | 12,323 | 124,189 | 74.2% | $15,738,983 | $126,724 |
| Finance & Insurance | 5,119 | 99,531 | 72.0% | $14,955,325 | $150,228 |
| Administrative & Support Services | 4,631 | 84,291 | 68.3% | $4,655,268 | $55,224 |
| Construction | 7,190 | 79,927 | 55.1% | $7,773,007 | $97,396 |
| Public Administration | 829 | 79,706 | 55.0% | $6,645,472 | $83,356 |
| Transportation & Warehousing | 2,162 | 79,076 | 67.9% | $5,817,200 | $73,528 |
| Wholesale Trade | 5,305 | 77,811 | 58.1% | $8,501,256 | $109,252 |
| Management of Companies | 1,069 | 74,213 | 85.6% | $11,079,313 | $149,032 |
| Other Services | 11,207 | 56,426 | 61.5% | $2,881,617 | $51,064 |
| Arts, Entertainment, & Recreation | 1,889 | 35,900 | 65.8% | $1,986,449 | $55,588 |
| Information | 2,070 | 28,725 | 61.5% | $3,456,131 | $120,276 |
| Real Estate, Rental, & Leasing | 4,428 | 27,077 | 75.5% | $2,016,935 | $74,516 |
| Utilities | 119 | 7,034 | 48.0% | $966,216 | $137,384 |
| Agriculture, Forestry, Fishing & Hunting | 303 | 3,577 | 15.3% | $161,154 | $45,136 |
| Mining | 40 | 532 | 9.2% | $79,700 | $152,308 |
| Source: DEED Quarterly Census of Employment and Wages (QCEW) | |||||
As previously noted, Health Care & Social Assistance is the Metro Area's largest employing industry sector. It also happens to be the region's largest-growing industry. Where the region's total employment between 2019 and 2024 decreased by 13,089 jobs (-0.7%), employment in Health Care & Social Assistance increased by 25,351 jobs (+9.1%). Other industries adding a significant number of jobs during that period include Public Administration (+6,601 jobs), Transportation & Warehousing (+5,279 jobs), Construction (+4,214 jobs) and Educational Services (+2,703 jobs).
Overall, eight of the region's 20 industry sectors added employment between 2019 and 2024. Losses were steepest in Finance & Insurance (-15,545 jobs), Administrative & Support Services (-12,994 jobs), Retail Trade (-9,396 jobs), Information (-6,497 jobs) and Accommodation & Food Services (-6,114 jobs) (Table 4).
More recently, between 2023 and 2024, the Metro Area gained 6,017 jobs (+0.3%). Growth during this period was also led by Health Care & Social Assistance (+12,362 jobs) and followed by Public Administration (+5,179 jobs), Educational Services (+3,290 jobs) and Accommodation & Food Services (+2,002 jobs). Overall, nine of the region's 20 industry sectors added employment between 2023 and 2024. Losses were steepest in Administrative Support & Waste Management Services (-4,389 jobs); Finance & Insurance (-4,368 jobs); Management of Companies (-3,424 jobs); Manufacturing (-3,080 jobs); and Professional, Scientific & Technical Services (-2,226 jobs).
| Table 4. Metro Area Industry Trends, Annual 2019 – 2024 Sorted by Number of Jobs | |||||
|---|---|---|---|---|---|
| Industry | 2024 Number of Jobs | 2023 – 2024 Job Change | 2019 – 2024 Job Change | ||
| Numeric | Percent | Numeric | Percent | ||
| Total, All Industries | 1,763,350 | +6,017 | +0.3% | -13,089 | -0.7% |
| Health Care & Social Assistance | 304,298 | +12,362 | +4.2% | +25,351 | +9.1% |
| Manufacturing | 172,772 | -3,080 | -1.8% | -289 | -0.2% |
| Retail Trade | 155,422 | +394 | +0.3% | -9,396 | -5.7% |
| Educational Services | 137,859 | +3,290 | +2.4% | +2,703 | +2.0% |
| Accommodation & Food Services | 134,980 | +2,002 | +1.5% | -6,114 | -4.3% |
| Professional, Scientific & Technical Services | 124,189 | -2,226 | -1.8% | -1,784 | -1.4% |
| Finance & Insurance | 99,531 | -4,368 | -4.2% | -15,545 | -13.5% |
| Administrative & Support Services | 84,291 | -4,389 | -4.9% | -12,994 | -13.4% |
| Construction | 79,927 | -257 | -0.3% | +4,214 | +5.6% |
| Public Administration | 79,706 | +5,179 | +6.9% | +6,601 | +9.0% |
| Transportation & Warehousing | 79,076 | +1,223 | +1.6% | +5,279 | +7.2% |
| Wholesale Trade | 77,811 | -1,132 | -1.4% | +680 | +0.9% |
| Management of Companies & Enterprises | 74,213 | -3,424 | -4.4% | -4,695 | -5.9% |
| Other Services | 56,426 | +671 | +1.2% | -919 | -1.6% |
| Arts, Entertainment & Recreation | 35,900 | +1,385 | +4.0% | -627 | -1.7% |
| Information | 28,725 | -1,393 | -4.6% | -6,497 | -18.4% |
| Real Estate & Rental & Leasing | 27,077 | -245 | -0.9% | -371 | -1.4% |
| Utilities | 7,034 | +101 | +1.5% | +812 | +13.1% |
| Agriculture, Forestry, Fishing & Hunting | 3,577 | -38 | -1.1% | +504 | +16.4% |
| Mining | 532 | -39 | -6.8% | -1 | -0.2% |
| Source: DEED Quarterly Census of Employment & Wages (QCEW) | |||||
Hiring Demand in the Metro Area
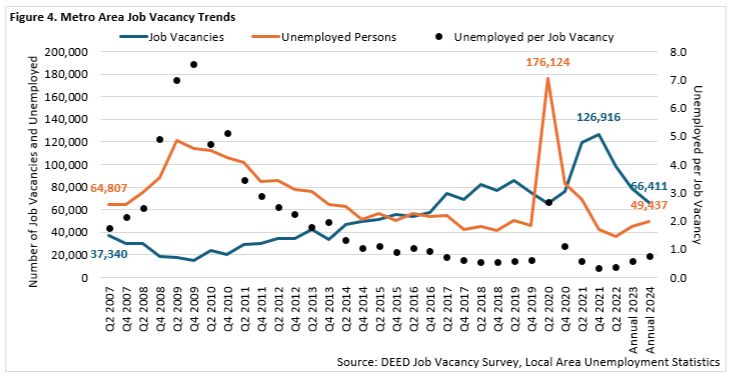
With all this hiring activity, the Metro Area has a large number and a wide range of job vacancies. According to DEED's Job Vacancy Survey (JVS), employers in the Metro Area reported just over 66,400 job vacancies in 2024. While this represents tens of thousands of openings available for career seekers, such openings have trended downward in recent years. After hitting a record of nearly 127,000 job vacancies during the fourth quarter of 2021, vacancies declined by 22.5% through the beginning of 2022. Vacancies further declined by 20.3% between the beginning of 2022 and annual 2023, and again by 17.9% between annual 2023 and 2024. While the methodology of the JVS has shifted slightly in recent years, and comparisons between various quarters and annual data should be noted with some scrutiny, there is no denying the fact that job vacancies have trended down between 2021 and 2024 (Figure 4).
While job vacancies have dropped and unemployment has slightly increased over the past three years, the Metro Area's labor market remains tight. With over 66,400 job vacancies and about 49,400 unemployed persons, the region had 0.7 unemployed persons per job vacancy in 2024. Outside of COVID extremes experienced in 2020, the Metro Area has had less than one unemployed person per job vacancy since 2016.
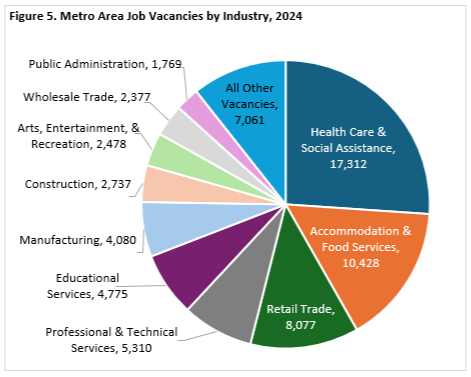
With Health Care & Social Assistance being the Metro Area's largest employing industry sector, it follows that it leads the region in the number of job vacancies. In fact, with over 17,300 job vacancies, Health Care & Social Assistance accounts for fully one quarter (26.1%) of the region's total job vacancies. Accommodation & Food Services, with over 10,400 jobs vacancies, and Retail Trade, with nearly 8,100 job vacancies, round out the region's top three industries having the most vacancies. Together, these three industries accounted for over half (53.9%) of the Metro Area's total job vacancies in 2024. Add in Professional & Technical Services, Educational Services, and Manufacturing and fully three-quarters (75.3%) of the Metro Area's total job vacancies are in just six industry sectors (Figure 5).
The median hourly wage offered for the total of all job vacancies in the Metro Area equaled $22.30 in 2024. Those industries with the highest median hourly wage offers were Professional & Technical Services ($43.10), Finance & Insurance ($42.82) and Management of Companies ($39.08). These industries with higher wage offers typically required more post-secondary education. For example, where 41% of the Metro Area's total job vacancies overall required post-secondary education, 86% of the region's Professional & Technical Services job vacancies did so. In contrast, 36% of the Metro Area's total job vacancies in 2024 did not require any formal educational credentials, 23% required a high school diploma or equivalent, 7% required vocational training, 7% required an associate degree, 22% required a bachelor's degree and 5% required an advanced degree.
Specific occupations with the most job vacancies in the Metro Area in 2024 included:
- Fast Food & Counter Workers (2,864 job vacancies; $14.95 median hourly wage offer)
- First-Line Supervisors of Food Preparation & Serving Workers (2,530; $19.54)
- Waiters & Waitresses (1,965; $11.09)
- Retail Salespersons (1,807; $16.04)
- Cashiers (1,756; $15.82)
- Nursing Assistants (1,680; $19.93)
- Registered Nurses (1,641; $39.41)
- Personal Care Aides (1,520; $18.38)
- Sales Representatives, Wholesale & Manufacturing (1,279; $23.30)
- Social & Human Service Assistants (1,208; $21.10)
- Software Developers (1,118; $58.49)
- Licensed Practical & Licensed Vocational Nurses (910; $27.64)
Altogether, just these 12 occupations accounted for 30.5% of the region's total job vacancies.
The State of the Region
With the release of new labor force data, industry data and hiring demand data, recent trends reveal a region that has many characteristics that are largely the same as they were five years ago. Considering the labor force, the Metro Area now has just as many people employed or unemployed as it did pre-pandemic. The unemployment rate, at 2.8% in 2024, is marginally lower than it was in 2019. Adding in job vacancy data shows the region's labor market remains tight. In 2024, there were 0.7 unemployed persons per job vacancy. This ratio, outside of 2020, has remained below 1.0 since 2016.
Likewise, industry data shows that the Metro Area continues to be Minnesota's largest employing region, accounting for three-fifths of the state's total employment. Health Care & Social Assistance, Manufacturing and Retail Trade continue to be the largest employing industries in the region. Select industries like Management of Companies; Professional, Scientific & Technical Services; and Finance & Insurance continue to make the region unique in the state for its employment opportunities. These conditions and trends show that many aspects of the Metro Area's labor market are remaining surprisingly unchanged.
Yet, the Metro Area is also changing rapidly. In one example, the region's labor force is growing much more rapidly in Washington, Scott and Carver counties. Similarly, the region is witnessing its fastest employment growth in Scott, Washington and Anoka counties. When breaking down the region's industry trends, Health Care & Social Assistance is leading growth by a significant margin. Meanwhile, five-year trends show employment losses most significantly in Finance & Insurance and Administrative Support & Waste Management Services.
As a final example, while the Metro Area's labor market remains tight, recent trends do show job vacancies are starting to decline to pre-pandemic levels. Many factors likely contribute to this trend, including the recovery of the post-pandemic job market, newer developments in automation and Artificial Intelligence, wage and inflation increases, and employer sentiment around hiring. Among these changing trends are, of course, demographic shifts. Two main shifts include the aging of the population and workforce and increasing racial and ethnic diversity. As much as things stay the same, the Twin Cities will continue to see changes occurring.

