 The presence of such industry powerhouses as Polaris, Arctic Cat and New Flyer make Northwest Minnesota a hub of transportation equipment manufacturing.
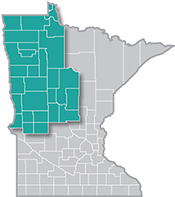
From wheat and potatoes to soybeans and sugar beets, the region is a major producer and processor of food staples and specialty agricultural products.
Want the freshest data delivered by email? Subscribe to our regional newsletters.
The 2024 population estimates were recently released, showing Northwest Minnesota’s population increased by 1,366 people
7/23/2025 11:40:37 AM
Anthony Schaffhauser
The 2024 population estimates were recently released, showing Northwest Minnesota's population increased by 1,366 people – continuing a growth trend driven entirely by people moving into the region rather than natural population increase. This analysis updates findings from my October 2024 blog examining Northwest population trends from 2020-2023. The new data shows the migration-driven growth pattern has not only continued but strengthened in terms of working-age population gains.
This migration-driven growth represents a significant shift for Northwest, where negative natural change (more deaths than births) has become the norm since 2021. The region's population gains now depend completely on attracting new residents from elsewhere – a trend that has important implications for the local workforce and economy (Figure 1).

Population increases in two ways: more people are born than die (positive natural change), or more people move in than move out (positive net migration). In Northwest, all recent growth comes from positive net migration.
The estimated population increase in 2024 topped the 1,295 people added in 2023. This was both from increased net domestic migration (moves within the U.S.) as well as increased international net migration (moves to and from other countries). These gains more than overcame the population loss from deaths exceeding births by 1,133 (Figure 2).

Natural change turned negative in 2021 and has remained so, with the deficit deepening in 2024. The negative natural change in 2021 and 2022 resulted primarily from increased deaths, while in 2023 and 2024, deaths stabilized but births declined further.
Births have trended downward since 2017 (except for a small increase in 2022), reflecting broader demographic patterns. This declining birth trend matches statewide and national patterns – births have been declining nationwide since 2007, as they have across Europe. The decline isn't simply due to an aging population; the U.S. fertility rate has also been declining since 2007.
Given this context, it's more remarkable that Northwest Minnesota maintained steady birth numbers from 2010 to 2017 than that they've declined since then. The births from 2010 to 2017 should provide a steady number of 16- to 18-year-olds entering the region's working-age population over the next decade.
While a stable number of new labor force entrants is welcome, the key question for the regional economy is whether or not net migration continues to boost the working-age population. To assess this, we can examine population changes by age group, specifically comparing the number of people four years older from four years in the past. If there are more people aged 16 to 64 in 2024 than there were aged 12 to 60 in 2020, the increase reflects positive net migration (with slight underestimation due to deaths, which are minimal for these age groups).
| Table 1: Northwest Minnesota 2020 to 2024 Net Migration Estimates for Age Groups Under 65 Years | |||||
|---|---|---|---|---|---|
| Age in 2020 | 2020 Population | Age in 2024 | 2024 Population | 2020 -2024 Change | |
| Number | Percent | ||||
| -4 to 10* | 103,254 | 0 to 14 | 106,132 | +2,878 | +2.8% |
| 11 to 20 | 75,907 | 15 to 24 | 74,216 | -1,691 | -2.2% |
| 21 to 50 | 191,319 | 25 to 54 | 194,016 | +2,697 | +1.4% |
| 51 to 60 | 74,832 | 55 to 64 | 76,602 | +1,770 | +2.4% |
| Up to 60 | 445,312 | 0 to 64 | 450,966 | +5,654 | +1.3% |
| * Includes births in 2021 to 2024 | |||||
| Source: U.S. Census Bureau, Population Estimates | |||||
From 2020 to 2024, Northwest Minnesota added an estimated 2,776 people to the working-age population through net migration. This represents an increase of 993 people compared to the 1,783 estimated for 2020 to 2023 in my previous analysis, indicating that 2024 was another strong year for working-age migration. However, note that the changes from my previous analysis are not all due to 2024 migration. Prior year estimates of net migration were also revised upward based on additional information gained.
The results show particularly positive trends:
While the COVID-related surge in domestic migration has moderated from its 2021-2022 peaks, the underlying trend remains positive for Northwest Minnesota's economy. The continued net migration of working-age adults, particularly those in their prime earning years, provides several benefits:
The 2024 population estimates confirm that net migration continues to drive population growth in Northwest Minnesota, with the workforce impact growing even stronger. For economic and workforce development professionals, this trend represents both an opportunity and a responsibility to ensure the region can continue attracting and retaining the workers needed for future economic growth.
For more information about population trends in Northwest Minnesota, contact Anthony Schaffhauser at anthony.schaffhauser@state.mn.us.
