A Resilient Recovery in Northeast Minnesota

by Carson Gorecki
June 2025
Northeast Minnesota's economy has exhibited resiliency over the past year. Many signs point toward a tight, but loosening labor market. Overall employment grew and unemployment remained under 4% while wage growth outpaced inflation. Yet the regional workforce remains smaller than before the pandemic, job vacancies are down slightly and recovery from the Pandemic Recession is ongoing in many sectors.
Local Area Unemployment Statistics (LAUS)
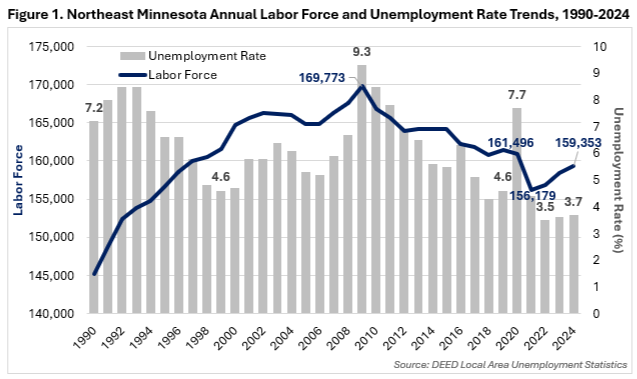
Annual data shows that Northeast Minnesota's labor force continued to grow through 2024 but has not yet returned to pre-pandemic levels (see Figure 1). The 159,350 workers in the region's labor force in 2024 was the culmination of three straight years of growth, which is the first time that has happened since the 2006 to 2009 period. Over the last three years, an average of 1,060 workers joined or rejoined the labor force each year. Despite this relatively consistent growth, the labor force remained more than 2,100 workers short of 2019 levels and is still more than 10,400 below the region's peak in 2009. Much of this longer-term decline can be attributed to the aging of the region's workforce. The region's labor force is now about the same size as it was in the mid-1990's.
DEED's Local Area Unemployment Statistics (LAUS) provides some of the most widely used and useful data to summarize labor market conditions for Northeast Minnesota. LAUS data can broadly be categorized as measures of employment (people currently working) and unemployment (people not currently working but actively searching). These two figures can be combined with population to create additional measures such as labor force participation and unemployment rates. The former consists of the sum of employment and unemployment divided into the employment-eligible population aged 16 years and older, and the latter is unemployment divided into the labor force. These numbers are available and updated monthly and annually.
The region's unemployment rate dropped to an all-time low of 3.5% in 2022. And while ticking up slightly to 3.7%, the rate remained historically low as of 2024, almost a full percentage point below the 2019 average rate. The size of the labor force declined 1.3% over five years, while the number of unemployed workers tumbled nearly 21% (-1,547 workers) over that same period, leading to the falling unemployment rate.
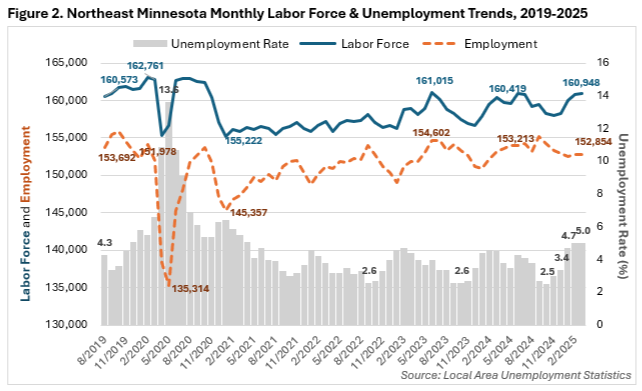
More recently, LAUS data shows a slightly more mixed picture. In the first quarter of this year, the regional labor force grew at a slower pace of 0.3% through March 2025, adding 530 workers (see Figure 2). The annual average rate of growth in the labor force has been slowing since 2022, with more month-to-month fluctuation. February represented the first time in almost four years that the unemployment rate hit 5%. However, the growth of unemployment in the last couple months was not enough to flip the average trend of decline over the last four years. The number of unemployed workers averaged 6,116 over the past year into March. That was up slightly from the average of 5,779 unemployed workers in 2023, but below the 2019 average of 7,486.
Industry Employment and Wage Characteristics and Trends
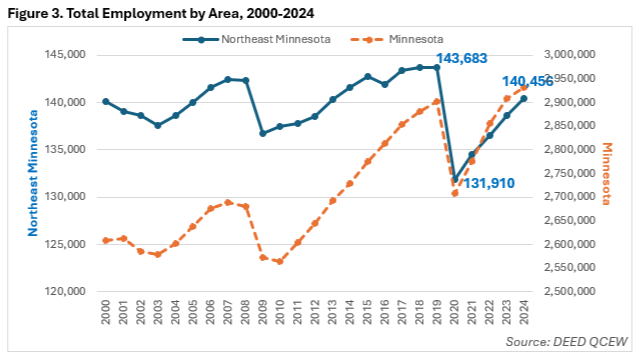
The Quarterly Census of Employment & Wages (QCEW) is DEED's best source for employment and wage data by detailed industry and geography. The most recent QCEW release covered data through the fourth quarter of 2024. Averaged over the year, Northeast Minnesota was home to 140,456 jobs at 9,421 employer establishments with an average annual wage of $58,500. Over the year into 2024, Northeast Minnesota added 1,844 jobs (+1.3%).
Employment levels remained down 2.2% from 2019, but growth occurred over each of the past four years (see Figure 3). Before 2023-2024, the last year when Northeast Minnesota's employment grew faster than the state was 2009-2010. Annual wage growth equaled +4.3% or an additional $2,392 for the average job. Wages in the region were 25.3% higher than in 2019, an increase of $11,804, not accounting for inflation.
Nearly half of the region's employment was in three sectors: Health Care & Social Assistance, Retail Trade and Accommodation & Food Services, with Health Care & Social Assistance alone accounting for 24.1% of jobs. Educational Services, Public Administration, Manufacturing and Construction had the next largest employment footprints in the region (see Table 1).
Out of 20 sectors, 11 added jobs over the year. The most jobs were added in Health Care & Social Assistance, Public Administration and Arts, Entertainment & Recreation. Likewise, the fastest growth occurred in those same service-providing sectors: Arts, Entertainment & Recreation, Health Care & Social Assistance and Public Administration.
Due to losses during the Pandemic Recession, only seven sectors had more jobs in 2024 than in 2019, and some - like Information, Finance & Insurance, Agriculture, Forestry, Fishing & Hunting, and Management of Companies - experienced double-digit percent declines. Conversely, sectors more closely aligned with goods production, such as Professional, Scientific & Technical Services (+7.1%), Construction (+6.3%), Utilities (+4.8%) and Manufacturing (+3.8%) fared the best over the last five years.
Mining, a significant sector in the region, paid the second-highest average wages at nearly $115,000 per year, just behind Utilities. No other industry paid above $100,000 on average. The sectors with the lowest average wages had ties to hospitality, tourism and personal service: Accommodation & Food Services; Arts, Entertainment & Recreation; Other Services; and Retail Trade. Each of these four sectors experienced below average wage growth over the year. Three sectors (Mining; Agriculture, Forestry, Fishing & Hunting; and Management of Companies) saw wages decline slightly.
| Table 1. Northeast Minnesota Industry Employment and Wage Statistics, 2019-2024 | ||||
|---|---|---|---|---|
| Industry | Employment (Number of Jobs) | Average Annual Wage | 2023-2024 Change in Jobs | |
| Numeric | Percent | |||
| Total, All Industries | 140,456 | $58,500 | +1,844 | +1.3% |
| Health Care & Social Assistance | 33,910 | $65,104 | +1,219 | +3.7% |
| Retail Trade | 16,969 | $34,528 | -82 | -0.5% |
| Accommodation & Food Services | 14,354 | $23,244 | +102 | +0.7% |
| Educational Services | 11,363 | $55,848 | -129 | -1.1% |
| Public Administration | 11,348 | $66,664 | +394 | +3.6% |
| Manufacturing | 9,227 | $74,620 | +129 | +1.4% |
| Construction | 7,446 | $80,808 | +75 | +1.0% |
| Other Services | 4,760 | $34,112 | +13 | +0.3% |
| Professional, Scientific & Technical Services | 4,669 | $85,436 | +72 | +1.6% |
| Mining | 4,227 | $114,868 | +130 | +3.2% |
| Transportation & Warehousing | 3,864 | $63,960 | -25 | -0.6% |
| Finance & Insurance | 3,684 | $78,104 | -178 | -4.6% |
| Arts, Entertainment & Recreation | 3,622 | $30,628 | +286 | +8.6% |
| Admin. Support & Waste Management Services | 3,127 | $38,532 | -108 | -3.3% |
| Wholesale Trade | 2,831 | $77,012 | -15 | -0.5% |
| Utilities | 1,537 | $115,492 | +47 | +3.2% |
| Real Estate & Rental & Leasing | 1,291 | $42,536 | +10 | +0.8% |
| Information | 1,032 | $54,652 | -52 | -4.8% |
| Management of Companies & Enterprises | 676 | $95,576 | -25 | -3.6% |
| Agriculture, Forestry, Fishing & Hunting | 514 | $47,892 | -19 | -3.6% |
| Source: DEED Quarterly Census of Employment & Wages | ||||
Occupational Employment & Wage Statistics
According to DEED's Occupational Employment & Wage Statistics (OEWS) survey, employers in Northeast Minnesota reported around 140,000 jobs with an hourly median wage of $23.47 and an annual median wage of $48,810, as of the first quarter of 2025 (see Table 2). The statewide ($26.22) and national ($24.13) median wages were both higher. By employment count, Northeast Minnesota was the smallest of the six planning regions and had the fourth-highest median wage.
By employment share, the largest occupational groups in the region were Office & Administrative Support, Food Preparation & Serving Related and Sales & Related occupations. The fourth and fifth largest groups were Healthcare Practitioners & Technical and Healthcare Support occupations. Each of those five occupational groups' employment was as or more concentrated when compared to their statewide shares as measured by location quotient. The most concentrated occupations in the region relative to the state were in Community & Social Service (1.52), Farming, Fishing & Forestry (1.45) and Construction & Extraction occupations (1.43). The least concentrated occupational groups in the region were Computer & Mathematical (0.45), Legal (0.53), Business & Financial Operations (0.61) and Production occupations (0.65).
| Table 2. Northeast Minnesota Occupational Employment and Wage Statistics, 2025 | ||||
|---|---|---|---|---|
| Occupational Group | Median Hourly Wage | Estimated Regional Employment | Share of Total Employment | Location Quotient |
| Total, All Occupations | $23.47 | 139,940 | 100.0% | 1.00 |
| Office & Administrative Support | $22.70 | 16,400 | 11.7% | 1.01 |
| Food Preparation & Serving Related | $14.56 | 14,420 | 10.3% | 1.25 |
| Sales & Related | $16.71 | 11,750 | 8.4% | 1.00 |
| Healthcare Practitioners & Technical | $40.04 | 11,570 | 8.3% | 1.29 |
| Healthcare Support | $18.28 | 10,020 | 7.2% | 1.18 |
| Transportation & Material Moving | $21.57 | 8,930 | 6.4% | 0.82 |
| Education, Training & Library | $25.07 | 8,410 | 6.0% | 1.03 |
| Construction & Extraction | $34.23 | 7,820 | 5.6% | 1.43 |
| Management | $46.38 | 7,780 | 5.6% | 0.81 |
| Installation, Maintenance & Repair | $30.21 | 6,770 | 4.8% | 1.34 |
| Production | $25.14 | 6,360 | 4.5% | 0.65 |
| Business & Financial Operations | $36.09 | 6,060 | 4.3% | 0.61 |
| Building, Grounds Cleaning & Maint. | $17.77 | 4,660 | 3.3% | 1.19 |
| Community & Social Service | $27.67 | 4,330 | 3.1% | 1.52 |
| Personal Care & Service | $17.15 | 3,520 | 2.5% | 1.16 |
| Protective Service | $27.12 | 3,020 | 2.2% | 1.34 |
| Architecture & Engineering | $40.58 | 2,240 | 1.6% | 0.81 |
| Computer & Mathematical | $38.42 | 2,100 | 1.5% | 0.45 |
| Life, Physical & Social Science | $36.86 | 1,730 | 1.2% | 1.12 |
| Arts, Design, Entertainment & Media | $23.54 | 1,280 | 0.9% | 0.74 |
| Legal | $40.98 | 530 | 0.4% | 0.53 |
| Farming, Fishing & Forestry | $24.08 | 230 | 0.2% | 1.45 |
| Source: DEED Occupational Employment & Wage Statistics, Qtr. 1 2025 | ||||
Median wages in the region varied from as low as $14.56 per hour for Food Preparation & Serving Related occupations to as high as $46.38 per hour for Management positions. Other occupational groups with high median wages were Legal, Architecture & Engineering and Healthcare Practitioners & Technical, each paying over $40 per hour. The occupational groups with the lowest wages, along with Food Preparation & Serving Related, were Sales & Related, Personal Care & Service and Building, Grounds Cleaning & Maintenance, which all were below $18 an hour.
Three occupational groups paid wages above the statewide median levels: Production, Farming, Fishing & Forestry and Construction & Extraction. These relatively higher wages reflect the strong natural resource-based economy in the region as well as some well-established Manufacturing industries such as Paper Manufacturing and Transportation Equipment Manufacturing.
Job Vacancy Survey
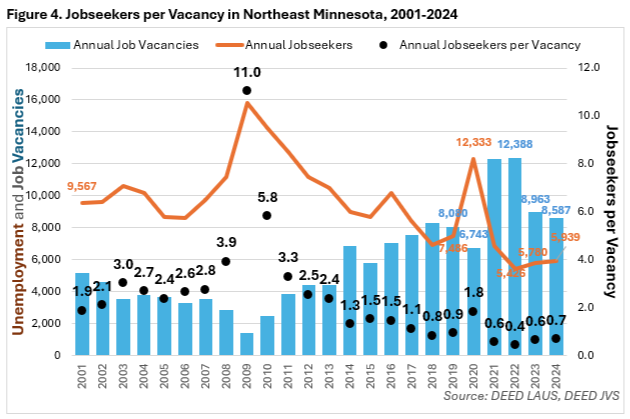
In 2024, Northeast Minnesota had an estimated 8,587 job vacancies, down slightly from 8,963 vacancies in 2023, a drop of 4.2% (see Figure 4). Statewide job vacancies declined as well, but to a greater degree (-13.4%). Central (-3.4%) and Southwest (-4.0%) were the only regions where vacancies declined slightly less than in Northeast Minnesota.
As a ratio of open jobs to the sum of open and filled positions, the job vacancy rate is a rough measure of demand for workers: the higher the rate, the higher demand for workers is likely to be. In 2024, Northeast Minnesota's job vacancy rate was 6.2%, the highest among the six Planning Regions in the state. In fact, 2024 was the third year of a four-year stretch in which Northeast has had the highest job vacancy rate in the state. In 2022, Northeast Minnesota's rate was second highest, a tenth of a percentage point behind Northwest.
The industries with the highest vacancy rates in the region were Other Services (11.2%), Accommodation & Food Services (9.3%), Wholesale Trade (8.3%) and Retail Trade and Health Care & Social Assistance (both at 8.2%). Conversely, Real Estate (0.9%), Mining (0.9%) and Manufacturing (1.6%) had the lowest vacancy rates.
Consistent, relatively high vacancy rates indicate higher demand for workers compared to other parts of the state or economy, which is likely a reflection of the tight labor market that persisted through 2024. The jobseeker per job vacancy ratio, a common measure of labor market tightness, ticked up three hundredths to 0.67. That is still the fourth lowest ratio in the 24 years of the survey, but the highest of the last four years, suggesting some loosening of the market (see Figure 4).
Four occupational groups accounted for over 55% of all openings in the region in 2024 (see Figure 5). Food Preparation & Serving Related and Sales & Related alone represented just under a third of all vacancies. The two Health Care occupational groups combined for an additional 24% of the total. By comparison, these four occupational groups were home to 34.1% of filled jobs in the region in 2025, indicating above-average demand for workers in these roles.
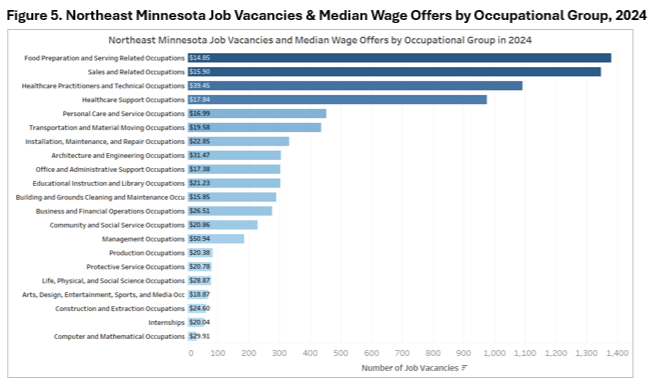
The median wage offer for openings in Northeast Minnesota in 2024 was $18.66 per hour. That was up slightly from $18.49 the year prior, an increase that did not outpace the rise of inflation. However, compared to 2019, median wage offers in the region were 15.6% higher when accounting for inflation and 42.1% without factoring for inflation. Over that five-year period, wage offers grew faster than overall wages. According to DEED's QCEW data, the average annual wage for filled jobs in the region grew 25.3%, not including the effects of inflation.
Summary
Despite signs of a loosening labor market, demand for workers in Northeast Minnesota remained high in 2024 in many industries. The labor force and employment continued to expand, with recent growth driven by Health Care, Leisure & Hospitality and other service-providing sectors. Job vacancies decreased slightly in 2024, but the job vacancy rate stayed high compared to other regions, reflecting ongoing labor demand, especially in service-oriented roles. Overall, the region continues to recover from pandemic impacts. Workforce size and sector-specific growth represent challenges, but positive trends in wages and employment show continued economic resilience.

