

Labor Market Shifts in Southeast Minnesota: Job Growth, Wages, and the Next Generation of Workers

By Amanda Blaschko, Southeast & South Central Regional Analyst
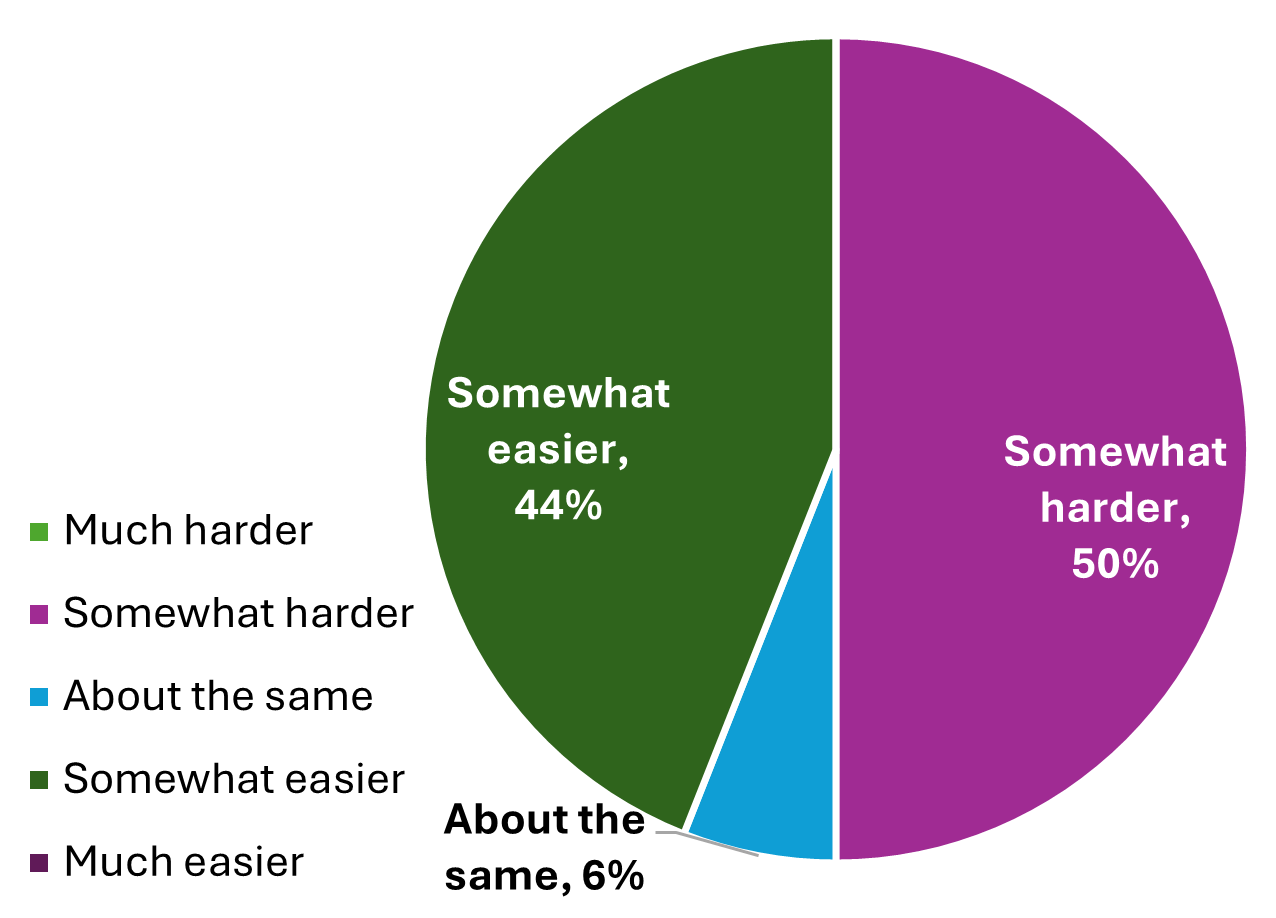
Southeast Minnesota's labor market is shifting as the unemployment rate ticks up, but the increase in available workers hasn't made hiring much easier for all employers. According to results from DEED's Employer Experience Survey, whether hiring feels harder or easier than a year ago depends on the occupation and industry. Half of regional responses from professionals that work with businesses in the region say it's gotten somewhat harder to hire, while 44% say it's gotten somewhat easier (Figure 1).
Figure 1. On average, compared to 1 year ago, how would you rate employers' ease of hiring for the positions they are trying to fill? Southeast Minnesota, February 2026
So, what does this mean for employers? The labor market may be less frantic than it was in 2022, but it hasn't quite shifted in employers' favor. According to the February 2026 Employer Experience Survey, which captures insights from economic development staff, Chamber representatives, and workforce development professionals who work directly with businesses, hiring difficulty varies widely. While the broader market is normalizing, some industries and occupations remain persistently tight.
Yet despite these constraints, the region had the highest percentage job growth of any planning region in Minnesota over the past year. Southeast added 1,700 jobs over the year, a 0.7% gain, well ahead of the statewide increase of 0.3%. This article explores which industries are adding jobs, how wages compare across occupational groups, and where the next generation of workers are headed.
Loosening Up
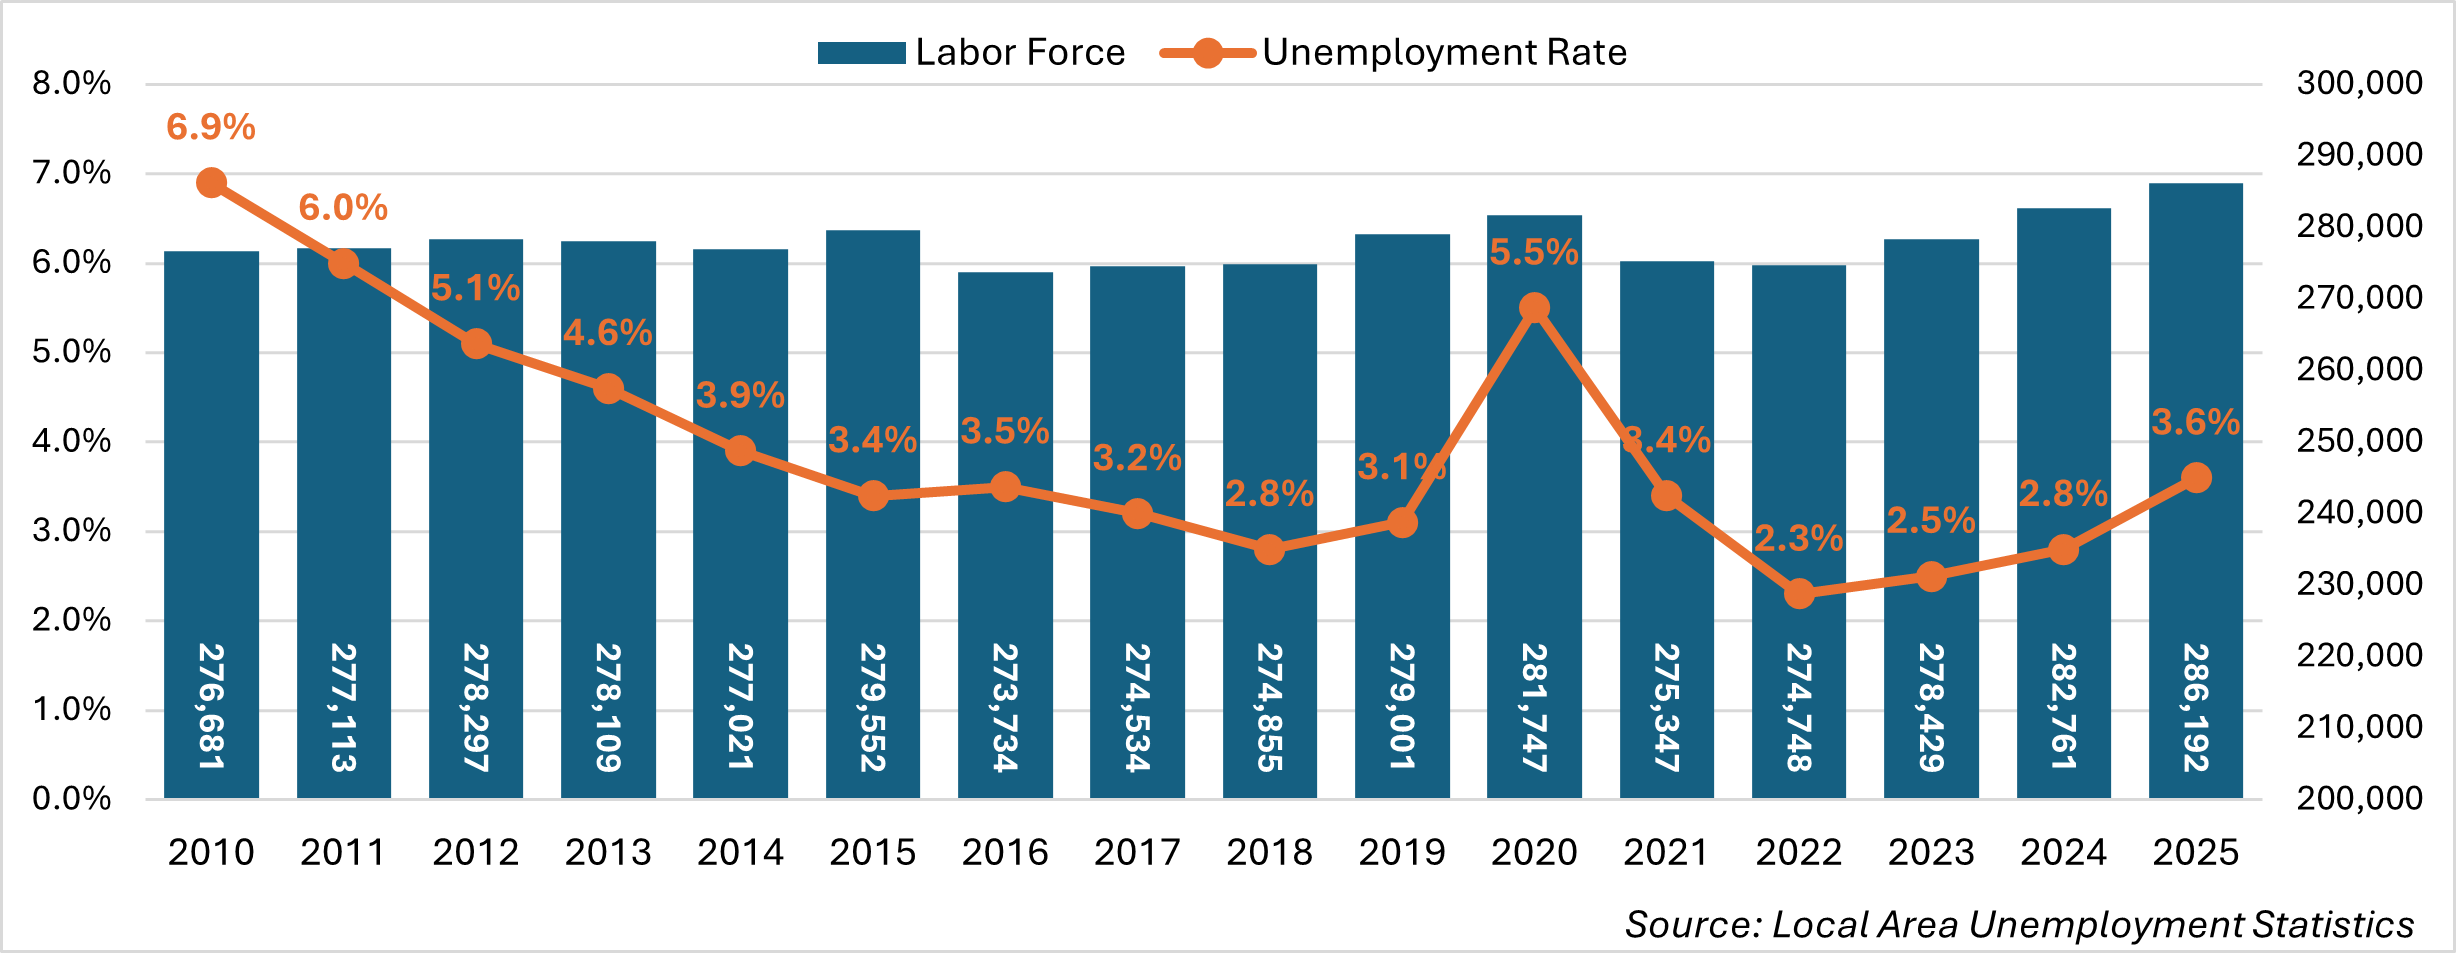
Southeast Minnesota's labor market is normalizing after years of tightness. The unemployment rate was extremely low at 2.3% in 2022, a level that forced employers to compete for workers (Figure 2). By 2025, it had risen to 3.6%, still lower than the statewide rate of 3.9%, but higher than it has been since 2014, with the exception of the spike in 2020 due to the Pandemic Recession. After three straight years of growth, the size of the labor force reached a new peak in 2025 at 286,192 people, though that growth included 3,932 additional unemployed people, a sign that the labor market is loosening, not tightening.
Figure 2. Average Annual Labor Force & Unemployment Rates in Southeast Minnesota
Even with ongoing hiring challenges for some employers, Southeast Minnesota continues to add jobs. The region experienced the largest percentage change in jobs over the past year, from 2024 to 2025, among all planning regions, increasing by 0.7% and adding 1,711 jobs. But those gains weren't spread evenly across industries (Table 1).
| Industry | Central | Northeast | Northwest | 7 County Twin Cities Metro | Southeast | Southwest | Minnesota |
|---|---|---|---|---|---|---|---|
| Total, All Industries | 0.1% | -0.5 | -0.5 | 0.4 | 0.7 | -0.6 | 0.3 |
| Accommodation & Food Services | 0 | -0.4 | -0.8 | -1 | 0 | -0.3 | -0.6 |
| Admin. Support & Waste Mgmt. Svcs. | -1.8 | -6.6 | 6.7 | -2.1 | 3.9 | 6.4 | -1.5 |
| Agriculture, Forestry, Fish & Hunting | 1.5 | -1.6 | 2.8 | 6.2 | -1.5 | -1.5 | 1.7 |
| Arts, Entertainment, & Recreation | 4.4 | 0.7 | 2.3 | 4 | 0.6 | 0.6 | 2.9 |
| Construction | 0.9 | -1.5 | -1.2 | 3.6 | 4 | -0.6 | 2.3 |
| Educational Services | -0.5 | -1.2 | 0.2 | 1.5 | 0.2 | 0.8 | 0.8 |
| Finance & Insurance | 1.1 | -5.2 | 0.2 | -0.7 | -0.8 | -1.6 | -1.3 |
| Health Care & Social Assistance | 2.3 | 1.8 | 2.3 | 5.5 | 2.7 | 3.7 | 4.4 |
| Information | -2.2 | -6.6 | -1.3 | -6.4 | -16.8 | -7.3 | -4.6 |
| Management of Companies | 4.4 | -6 | 10.3 | -3.7 | 2 | -4.9 | -2.6 |
| Manufacturing | -1.5 | 3.7 | -3.1 | -1.8 | -0.1 | -3.4 | -1.6 |
| Mining | 1.3 | -6.6 | -3.4 | 7.3 | 6.6 | 11.3 | -3.2 |
| Other Services | -0.3 | -5.3 | -2.9 | -1.1 | -1.9 | -2.7 | -1 |
| Professional & Technical Services | -3.3 | -2.7 | -2.8 | -1.7 | -0.2 | 2.3 | -0.9 |
| Public Administration | -0.3 | -0.1 | 0.3 | 2.8 | 0.2 | -1.1 | 1.4 |
| Real Estate & Rental & Leasing | 1.6 | 4.9 | -2.1 | -0.2 | 0.3 | -14.5 | -0.3 |
| Retail Trade | -0.1 | -0.3 | -1.7 | -2.4 | -0.6 | -1.5 | -1.6 |
| Transportation & Warehousing | -2.8 | -5.1 | -1.6 | -0.5 | 1.3 | -1 | -0.8 |
| Utilities | 0.9 | 2 | 1 | 1.5 | 0.4 | -1.6 | 1.1 |
| Wholesale Trade | 0.3 | -2.7 | -4 | -0.9 | -4.9 | -4.3 | -0.8 |
| Source: Quarterly Census of Employment & Wages | |||||||
The Largest Numeric Gains
Health Care & Social Assistance, the largest industry in Southeast Minnesota, added 1,820 jobs, far more than any other sector. But that growth wasn't evenly distributed. Ambulatory Health Care Services, which includes offices of physicians, outpatient clinics and specialist practices, added 968 jobs paying an annual average wage of about $119,650. Social Assistance added 447 jobs, but with an average annual wage of just $32,100, a 6.5% increase that made it the fastest-growing subsector in the Health Care & Social Assistance industry. Both Hospitals and Nursing & Residential Care Facilities saw smaller employment growth over the year.
Adding 411 new jobs at an average annual wage of $78,990, Construction posted the highest percentage job increase of all planning regions: 4% compared to Minnesota's 2.3% overall growth. Specialty Trade Contractors led the way, adding 257 jobs at $76,750 per year. This subsector includes plumbing, electrical, roofing, and excavation work. Heavy & Civil Engineering Construction contributed 125 net new jobs paying $91,575 annually, a 7.3% increase, reflecting ongoing residential projects and the expansion of infrastructure and commercial development across the region.
Administrative Support & Waste Management Services added 283 jobs, a 3.9% increase that stands out because the state as a whole declined by 1.5% in that sector. The growth in Southeast was fueled by a subsector that provides outsourced business functions like temporary staffing, building maintenance, security services, and business support services.
Southeast Minnesota also defied the statewide downward trend in Transportation & Warehousing, adding 107 jobs, a 1.3% increase, while all other planning regions lost jobs during the same period. Northeast Minnesota experienced the largest percentage decline. In Southeast, employment growth came from the Transit & Ground Passenger Transportation subsector and the Warehousing & Storage subsector.
The Largest Numeric Losses
However, not every sector shared in the region's growth. Information lost 367 jobs, a 16.8% decline that was the steepest of any planning region in Minnesota. Telecommunications, which includes establishments that build and operate the infrastructure that enables voice, data, video, and internet communication, bore the majority of the loss, shedding 300 jobs, amounting to a 32% decline.
Wholesale Trade dropped 327 jobs, a 4.9% decrease concentrated in the Merchant Wholesalers of Durable Goods subsector, which shed 261 jobs. Merchant Wholesalers of Durable Goods distribute products like machinery, vehicles, construction materials, and electronics from manufacturers to retailers and business customers. The pattern extended across Minnesota, with all planning regions except Central Minnesota experiencing Wholesale Trade losses. At $85,750 a year, these jobs pay above the regional average.
Retail Trade lost 160 jobs, a modest 0.6% decline. Losses, however, were uneven across subsectors. Furniture, Home Furnishings, Electronics, & Appliance Retailers shed 45 jobs, a 5.4% drop. General Merchandise Retailers shaved 63 jobs, and Building Material & Garden Equipment Dealers lost 42 jobs, while Food & Beverage Stores broke from this pattern, adding 97 jobs between 2024 and 2025.
Overall, some industries were adding jobs while others were cutting them. The gains are concentrated in Health Care & Social Assistance, Construction, and Administrative Support & Waste Management Services, while Information, Wholesale Trade and Retail Trade were contracting.
Wages
To fill jobs, employer establishments must attract workers, and wages are a key part of the hiring equation. Southeast Minnesota's median wage across all occupations was $26.11 per hour in the first quarter of 2026, ranking second highest among the six planning regions in the state. The statewide median was $27.97, about $1.86 higher; but was pulled higher by the seven county Twin Cities metro area, which led the state at $29.43 per hour, $3.32 higher than Southeast (Table 2).
| Occupational Groups | Southeast Minnesota | Minnesota | |
|---|---|---|---|
| Estimated Employment | Median Hourly Wage | Median Hourly Wage | |
| Total, All Occupations | 246,900 | $26.11 | $27.97 |
| Architecture & Engineering Occupations | 3,450 | $45.82 | $47.91 |
| Arts, Design, Entertainment, Sports, & Media Occupations | 2,310 | $29.02 | $30.88 |
| Building & Grounds Cleaning & Maintenance Occupations | 7,180 | $19.19 | $20.13 |
| Business & Financial Operations Occupations | 10,850 | $39.51 | $40.71 |
| Community & Social Service Occupations | 4,700 | $31.75 | $30.63 |
| Computer & Mathematical Occupations | 5,850 | $54.00 | $51.47 |
| Construction & Extraction Occupations | 8,910 | $33.57 | $35.85 |
| Educational Instruction & Library Occupations | 14,390 | $29.41 | $29.40 |
| Farming, Fishing, & Forestry Occupations | 260 | $23.33 | $23.48 |
| Food Preparation & Serving Related Occupations | 21,960 | $15.69 | $16.69 |
| Healthcare Practitioners & Technical Occupations | 28,190 | $48.92 | $48.85 |
| Healthcare Support Occupations | 13,680 | $20.51 | $19.92 |
| Installation, Maintenance, & Repair Occupations | 8,630 | $30.57 | $31.11 |
| Legal Occupations | 850 | $40.28 | $51.94 |
| Life, Physical, & Social Science Occupations | 5,420 | $40.42 | $41.10 |
| Management Occupations | 13,200 | $56.50 | $61.90 |
| Office & Administrative Support Occupations | 26,190 | $24.53 | $25.05 |
| Personal Care & Service Occupations | 5,580 | $17.79 | $18.07 |
| Production Occupations | 22,120 | $23.33 | $24.24 |
| Protective Service Occupations | 4,530 | $30.31 | $29.08 |
| Sales & Related Occupations | 19,140 | $17.65 | $19.09 |
| Transportation & Material Moving Occupations | 19,530 | $22.43 | $23.37 |
| Source: Occupational Employment & Wages Statistics | |||
While Southeast Minnesota's overall median wage trailed the state and Twin Cities metro, the region showed competitive or even superior wages in several occupational groups. Computer & Mathematical occupations stand out, with Southeast workers earning a median of $54.00 per hour, which was $2.53 above the state median and $1.31 above the Twin Cities. Likewise, the Community & Social Service occupational group also earned more locally ($31.75) than their counterparts statewide ($30.63) or in the metro ($30.71). Protective Service occupations followed a similar pattern, with Southeast wages of $30.31 exceeding both the state ($29.08) and metro ($27.13) by notable margins.
In contrast, the largest wage gaps appeared in occupational groups typically concentrated in major metro areas. Legal occupations showed the widest disparity, with Southeast Minnesota's median of $40.28 falling $11.66 below the state median and $15.67 below the Twin Cities. Management occupations also reflected significant regional differences, with local wages at $56.50 compared to $61.90 statewide and $65.36 in the metro, a gap of $8.86. Business & Financial Operations, Construction & Extraction, and Sales & Related occupations all showed wage premiums favoring the Twin Cities by $3 to $5 per hour.
The College-to-Workforce Shift
Competitive wages help attract workers now, but the region's future workforce is shaped by what high school graduates do after graduation. Data from the Statewide Longitudinal Education Data System (SLEDS) shows Southeast Minnesota's class of 2024 made different choices than graduates a decade earlier. Most notably, college enrollment has declined while immediate workforce entry has increased.
In fall 2024, 58% of Southeast Minnesota high school graduates enrolled in college immediately after graduation. A decade earlier, in fall 2014, that figure was 68%. The 10-percentage-point drop affected both in-state and out-of-state enrollment. Minnesota college enrollment fell from 46% to 41%, and out-of-state enrollment dropped from 22% to 18%.
But the shift isn't happening uniformly across all graduates. Female students remain far more likely to enroll in college than their male peers, with 67% enrolling compared to 49% of male graduates. Graduates of color also enrolled at lower rates than white graduates, 51% compared to 61%, with the starkest difference appearing in out-of-state enrollment. Only 7% of graduates of color left Minnesota for college, compared to 21% of white graduates.
Among Southeast graduates who did enroll in college, most stayed close to home. The top two destinations were Rochester Community & Technical College with 494 students and Riverland Community College with 291 students. Together, these two local institutions captured 785 graduates, more than the University of Minnesota-Twin Cities, Winona State, and Minnesota State Mankato combined.
Interestingly, Southeast Minnesota graduates were more likely to choose two-year public colleges than their statewide peers, 36% compared to 28% statewide. They were less likely to enroll in private four-year institutions at 9% compared to 14% statewide. This suggests a preference for shorter-term credentials close to home, though it does not preclude students from transferring to four-year programs later.
One year after graduation, 29% of the class of 2024 were working in Minnesota but had not enrolled in college. In 2014, that figure was 24%. Male graduates drove much of this increase, with 34% working in Minnesota compared to 24% of female graduates.
The "unknown" category also grew from 7% to 12%, with graduates not found enrolled or working in Minnesota falling into this group. They may be working in another state, enlisted in military service, self-employed, working for organizations not subject to state reporting, or not engaged in the labor force. Male graduates were twice as likely to fall into this category at 17%, compared to 8% for female graduates. The increase suggests more graduates are exiting the traditional pathways, though it's unclear whether by choice or circumstance.
Summary
Taken together, the labor market is changing from the years of tightness, though the shift depends on industry and occupation. Health Care & Social Assistance, Construction, and Administrative Support & Waste Management Services are adding jobs while Information, Wholesale Trade, and Retail Trade are contracting. Wages in the region remain competitive for some occupations but trail statewide rates in others. At the same time, fewer high school graduates are heading straight to college, with more entering the workforce immediately after graduation. The pieces are moving in different directions, but the region continues to add jobs even as the labor market adjusts.