

Northeast Minnesota’s Workforce: Cooling Momentum

By Carson Gorecki, DEED Regional Labor Market Analysts for Northeast Minnesota
Labor Force and Unemployment Trends
The gradual labor force and employment growth of the past several years in Northeast Minnesota continued into 2025, yet showed recent signs of plateauing. Since 2021, 4,800 workers joined or rejoined the labor force in the region. That means the region only recently eclipsed the labor force decline of 4,500 seen from 2020-2021 (see Figure 1). Compared to the rest of the state, the Northeast labor force declined slightly faster in 2021 and has grown slightly slower since. Over-the-year labor force declines in the first three months of 2026 represent the first time since late 2021 that the labor force has declined annually in consecutive months.
Meanwhile, the unemployment rate, which reached historic lows in 2022, has gradually increased as well. The increase in the unemployment rate accelerated toward the end of 2025 and into 2026 as employment, which had been growing roughly in tandem with the labor force, began to turn to over-the-year declines a couple months before the labor force followed suit. The result was the growth of the unemployment rate by a full percentage point over the year into January 2026.
Northeast Minnesota's unemployment rate is typically higher than the state's due to the higher concentration of employment in industries that tend to fluctuate depending on the season, such as Leisure & Hospitality and Construction, or others like Mining that are more exposed to global economic factors. Since 2021, the Northeast unemployment rate was on average 28% higher than the state's rate. This, however, represented a closing of the gap with the rest of the state. Prior to the pandemic, the Northeast rate was on average 43% higher than the state rate. Despite the recent increase of the unemployment rate, the 2025 average rate of 5.0% was still slightly below the average rate in the region leading up to the pandemic, when it was 5.2% from 2015-2019.
Figure 1. Labor Force & Unemployment Trends in Northeast Minnesota, 2019-2026
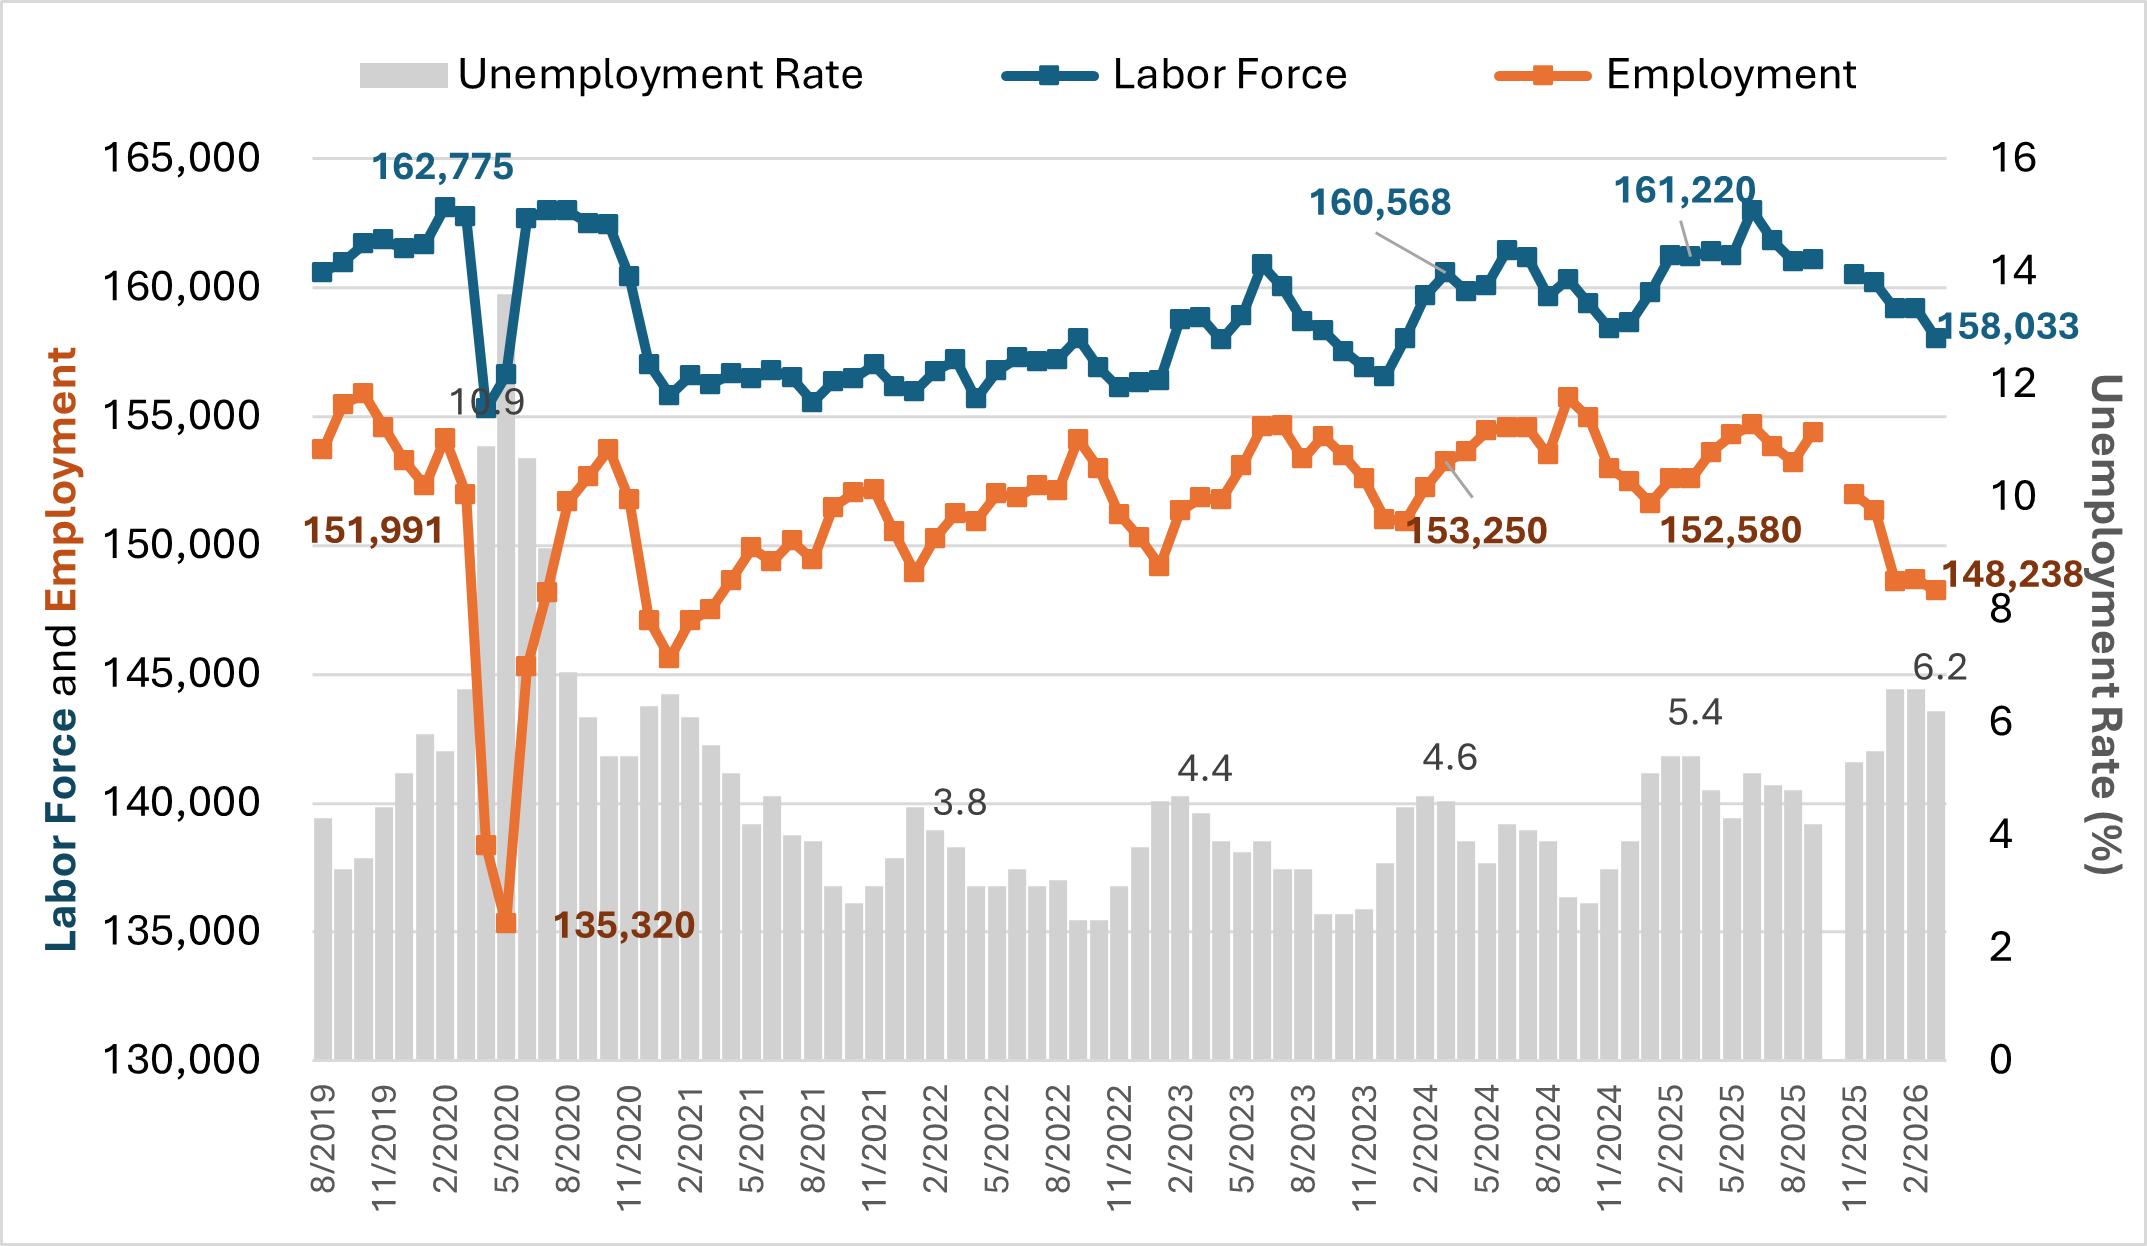
Source: Local Area Unemployment Statistics. No October 2025 data was published due to the federal shutdown.
Within the region, counties largely saw their workforces move in the same direction. From 2024 to 2025 only Koochiching County (-0.8%) saw its labor force shrink. The slowest labor force growth occurred in Itasca (+0.2%) and Cook (+0.6%) counties, while Lake (+2.1%) and Aitkin (+1.8%) saw the fastest growth. Carlton County saw 1.0% labor force growth while St. Louis County, at 0.9% growth, added the most workers over the year with 930.
Industry Employment and Wages
As of the end of 2025, Northeast Minnesota had yet to regain pre-COVID employment levels. The region added nearly 8,000 jobs between 2020 and 2025, yet remained 3,800 jobs (-2.7%) below 2019 employment counts (see Figure 2). In fact, the regional employment trend showed an annual decline into 2025, shedding more than 730 jobs (-0.5%). These most recent losses were spread across multiple industry sectors. Fifteen out of twenty sectors saw employment declines over the year.
Figure 2. Total Employment and Establishment Trends in Northeast Minnesota, 2008-2025
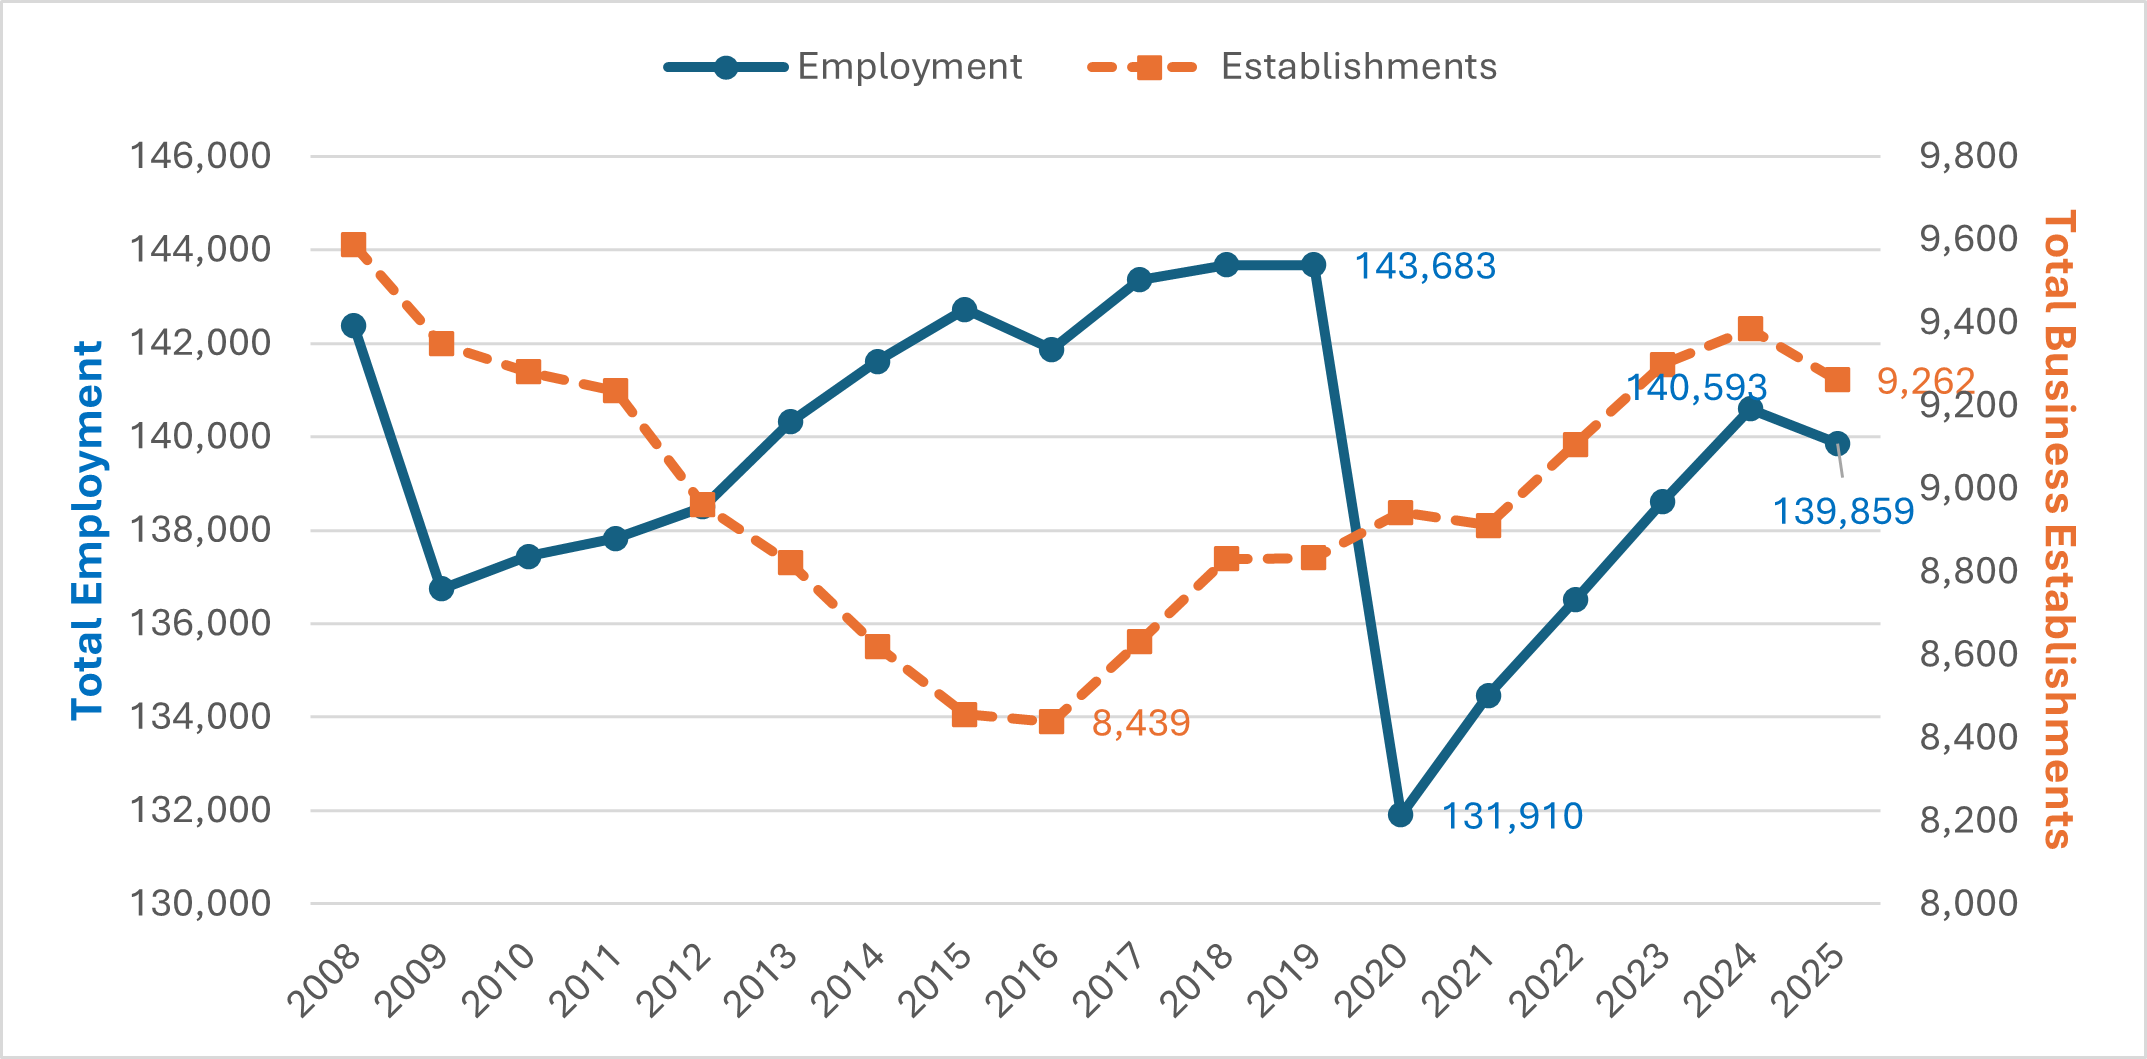
Source: DEED Quarterly Census of Employment and Wages
The sector that saw the largest declines on both a numeric and percent basis was Mining, which suffered significant layoffs early in 2025. The Mining sector had 277 fewer jobs in 2025, a percent decrease of 6.6%. Other sectors with sizable numeric losses included Other Services, Administrative Support & Waste Management Services, Transportation & Warehousing, and Finance & Insurance (see Table 2).
Of the five sectors that grew over the year, Health Care & Social Assistance stood out with the addition of over 600 jobs. Manufacturing added the second-most jobs with 345 while Real Estate & Rental & Leasing, Utilities, and Arts, Entertainment, & Recreation saw relatively small numeric gains. Job gains in Health Care & Social Assistance are a welcome sign as it is the largest sector in the region, accounting for one out of every 4 jobs. Manufacturing, while a smaller sector, has been on its longest stretch of growth since 2000.
| Industry Title | Number of Jobs | Avg. Annual Wage | 2024-2025 Numeric Change in Jobs | 2024-2025 Percent Change in Jobs | 2020-2025 Percent Wage Change |
|---|---|---|---|---|---|
| Total, All Industries | 139,859 | $60,580 | -734 | -0.5% | +23% |
| Health Care & Social Assistance | 34,607 | $67,548 | 621 | +1.8% | +25% |
| Retail Trade | 16,936 | $35,568 | -55 | -0.3% | +20% |
| Accommodation & Food Services | 14,321 | $23,660 | -55 | -0.4% | +36% |
| Public Administration | 11,346 | $69,472 | -11 | -0.1% | +22% |
| Educational Services | 11,224 | $57,460 | -142 | -1.2% | +15% |
| Manufacturing | 9,576 | $79,404 | 345 | +3.7% | +24% |
| Construction | 7,341 | $83,408 | -110 | -1.5% | +28% |
| Professional & Technical Services | 4,550 | $87,412 | -124 | -2.7% | +29% |
| Other Services | 4,507 | $35,308 | -252 | -5.3% | +13% |
| Mining | 3,950 | $116,688 | -277 | -6.6% | +31% |
| Transportation & Warehousing | 3,670 | $67,600 | -199 | -5.1% | +25% |
| Arts, Entertainment, & Recreation | 3,630 | $32,656 | 25 | +0.7% | +23% |
| Finance & Insurance | 3,495 | $78,364 | -192 | -5.2% | +26% |
| Admin. Support & Waste Mgmt. Svcs. | 2,924 | $41,860 | -207 | -6.6% | +29% |
| Wholesale Trade | 2,748 | $77,688 | -77 | -2.7% | +23% |
| Utilities | 1,568 | $122,148 | 30 | +2.0% | +21% |
| Real Estate & Rental & Leasing | 1,352 | $46,072 | 63 | +4.9% | +34% |
| Information | 964 | $55,848 | -68 | -6.6% | +8% |
| Management of Companies | 637 | $104,624 | -41 | -6.0% | +13% |
| Ag., Forestry, Fishing & Hunting | 508 | $50,648 | -8 | -1.6% | +23% |
| Source: DEED Quarterly Census of Employment and Wages | |||||
Wage growth in the region accelerated during and after the COVID pandemic. From 2010 to 2019 annual wage growth across all industries averaged 2.7%. From 2020 to 2025, average wage growth increased to 4.1% on an annual basis. Wage growth in the post-pandemic period was concentrated in some low-paying sectors, as well as in some that already paid relatively high wages.
The highest relative growth over the past five years occurred in the sector with the lowest average wages. Accommodation & Food Services, which had an average wage of $23,600 in 2025, saw wages grow by more than a third (+36%). Other sectors that saw five-year wage growth near or above 30% included Administrative Support & Waste Management Services, Real Estate & Rental & Leasing, Mining, Professional, Scientific & Technical Services and Construction. The former two were among the 6 lowest paying sectors and the latter three were all among the top-five highest paying sectors.
Since 2020, only Real Estate & Rental & Leasing experienced above average wage growth in all five years. Conversely, only Other Services saw below-average wage growth in all five years. Even the sectors with the fastest (Accommodation & Food Services) and slowest (Information) growing wages had at least one year above or below average.
Average wage growth was slower than average for workers in Educational Services and Public Administration until about 2023. Then from 2023-2024 they were among the sectors with the fastest-growing wages. This appears to have been a one-time above-average increase, likely reflective of pay increases won via collective bargaining that is more common in public sector employment in these two sectors. Despite significantly faster growth in 2023-2024, Educational Services and Public Administration saw wages grow slower than average over the past five years (see Table 1).
Occupational Employment and Wages
Data from DEED's Occupational Employment & Wage Statistics (OEWS) program provides a detailed view into pay and employment patterns by type of job. As of the first quarter of 2026, Northeast Minnesota had a median hourly wage of $24.45 across all occupations, equivalent to an annual median wage of $50,849 (see Table 2). Northeast Minnesota was the smallest of the six planning regions in terms of total employment, but ranked 4th in terms of wage, ahead of Northwest and Southwest Minnesota. The regional median wage was equivalent to 87.4% of the statewide median.
| Area | Median Hourly Wage | Estimated Regional Employment |
|---|---|---|
| Minnesota | $27.97 | 2,949,820 |
| Twin Cities Metro | $29.43 | 1,780,910 |
| Central Minnesota | $24.57 | 281,730 |
| Southeast Minnesota | $26.11 | 246,900 |
| Northwest Minnesota | $23.70 | 224,140 |
| Southwest Minnesota | $23.88 | 170,490 |
| Northeast Minnesota | $24.45 | 140,570 |
Against the backdrop of lower-than-average wages, certain occupations and occupational groups in the region stood out. Of the 22 occupational groups in the Standard Occupational Classification structure (SOC), four exhibited higher median wages in Northeast Minnesota when compared to the statewide numbers. The Farming, Fishing & Forestry; Production, Protective Service, and Installation, Maintenance & Repair occupational groups had higher median wages than their statewide counterparts.
An additional 13 occupational groups paid median wages that were between 87.4% and 100% of the occupational group wages at the statewide level. The occupational groups that had median wage ratios below the regional average were Legal, Management, Computer & Mathematical and Architecture & Engineering. That list includes four of the top six highest-paying occupational groups. The other two were Healthcare Practitioners & Technical and Life, Physical, & Social Science (see Table 3).
The lowest paying occupational groups in the region were Food Preparation & Serving Related, Sales & Related and Personal Care & Service. Those three groups accounted for over a fifth of all jobs in the region. Conversely, the three highest-paying occupational groups represented 15.5% of regional employment, mainly due to the number of Healthcare Practitioner & Technical jobs.
Indeed, Healthcare jobs were more concentrated in Northeast Minnesota when compared to the rest of the state based on the location quotient metric. By this measure, the most concentrated occupational groups in the region were Farming, Fishing & Forestry (location quotient = 1.5), Construction & Extraction (1.4), Community & Social Service (1.4), Installation, Maintenance & Repair (1.3) and Protective Service (1.3). The relative concentration of these jobs reflects industries mostly unique to the region like Mining, Logging and Forestry. The least concentrated occupational groups were those consisting of jobs typically requiring higher levels of education or training: Computer & Mathematical, Legal and Business & Financial Operations.
| Occupational Group | Employment | Hourly Median Wage | Employment Location Quotient | Wage Ratio |
|---|---|---|---|---|
| Total, All Occupations | 140,570 | $24.45 | 1.00 | 0.87 |
| Office & Administrative Support | 15,210 | $23.76 | 0.98 | 0.95 |
| Food Preparation & Serving Related | 14,590 | $15.02 | 1.26 | 0.90 |
| Sales & Related | 12,100 | $17.06 | 1.01 | 0.89 |
| Healthcare Practitioners & Technical | 11,810 | $44.18 | 1.26 | 0.90 |
| Healthcare Support | 10,240 | $18.84 | 1.14 | 0.95 |
| Transportation & Material Moving | 9,300 | $22.05 | 0.84 | 0.94 |
| Construction & Extraction | 8,440 | $34.75 | 1.45 | 0.97 |
| Educational Instruction & Library | 8,240 | $28.33 | 1.02 | 0.96 |
| Management | 7,850 | $48.29 | 0.81 | 0.78 |
| Production | 6,670 | $27.74 | 0.70 | 1.14 |
| Installation, Maintenance & Repair | 6,480 | $31.21 | 1.34 | 1.00 |
| Business & Financial Operations | 5,920 | $37.51 | 0.60 | 0.92 |
| Building & Grounds Cleaning & Maintenance | 4,830 | $18.16 | 1.23 | 0.90 |
| Community & Social Service | 4,140 | $29.92 | 1.41 | 0.98 |
| Personal Care & Service | 3,610 | $17.71 | 1.11 | 0.98 |
| Protective Service | 3,040 | $29.40 | 1.31 | 1.01 |
| Architecture & Engineering | 2,230 | $41.81 | 0.81 | 0.87 |
| Computer & Mathematical | 1,960 | $40.18 | 0.43 | 0.78 |
| Life, Physical & Social Science | 1,770 | $39.24 | 1.16 | 0.95 |
| Arts, Design, Entertainment, Sports & Media | 1,280 | $24.65 | 0.72 | 0.80 |
| Legal | 570 | $39.08 | 0.55 | 0.75 |
| Farming, Fishing & Forestry | 270 | $28.55 | 1.52 | 1.22 |
| Source: DEED Occupational Employment and Wage Statistics | ||||
Summary
Following several years of post‑pandemic recovery, labor market conditions in Northeast Minnesota showed signs of slowing in early 2026. Labor force gains have started to slow, unemployment has edged upward, and regional employment remains below pre‑COVID levels. Average wages in the region remain lower than in other areas of the state. Relative wages varied substantially by occupational group, with regional advantages in Protective Service, Production and Installation, Maintenance and Repair. At the same time, wage growth continues across many industries, and sectors such as Health Care and Manufacturing have emerged as areas of stability and expansion.