What’s Driving the Growth in Self-Employment?

By Cameron Macht
September 2025
Summary:
Self-employment surged to over 453,000 establishments in Minnesota in 2023, adding nearly 44,000 since the pandemic and more than 104,000 over the past two decades. Recent growth has been led by Transportation through gig platforms, alongside gains in Professional Services, Education and Health Services, Real Estate, and creative fields, while a few other industries have declined. The self-employed workforce is also becoming more diverse, with rising ownership among people of color and women, signaling both new opportunities and ongoing shifts in the state's evolving economy.
Key Points:
- Minnesota added nearly 11,000 self-employed businesses from 2022–2023, reaching 453,000 total, with long-term growth of 30% since 2003.
- Transportation & Warehousing became the state's largest self-employment industry in 2023, accounting for almost 60% of recent growth.
- While the Professional Services, Leisure & Hospitality, Educational Services, Health Care & Social Assistance, and Real Estate industries expanded, more detailed sub-sectors like child care and parts of retail trade saw declines.
- Self-employment is also diversifying, with significant increases among Black, Hispanic, Asian, and Native American entrepreneurs, as well as women owning about 40% of nonemployer firms.
What's Driving the Growth in Self Employment?
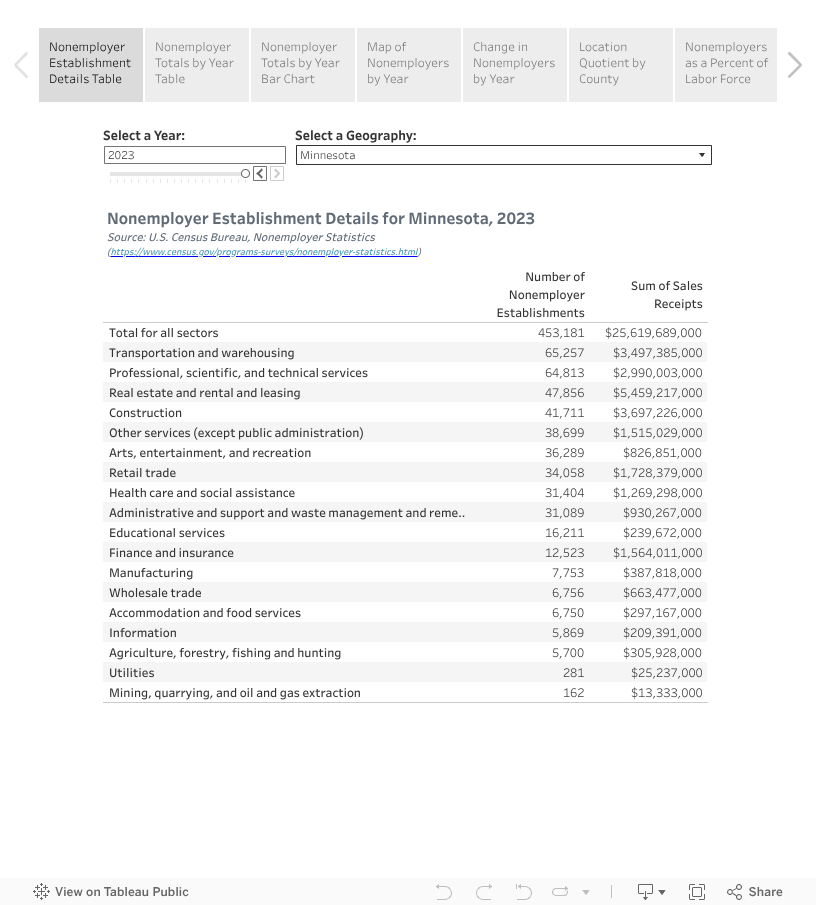
Extending the recent surge in self-employment, new data released by the Census Bureau in May show that Minnesota added nearly 11,000 more nonemployer establishments from 2022 to 2023, a further 2.4% increase. Since the pandemic-related drop in 2020, Minnesota has gained 43,750 additional self-employed businesses, bringing the total number to more than 453,000 nonemployer establishments in 2023 (Table 1).
| Table 1. Number of Nonemployer Establishments in Minnesota, 2023 | Number of Nonemployer Establishments | Change in Nonemployers, 2022-2023 | |
|---|---|---|---|
| Number | Percent | ||
| Total, All Industries | 453,181 | +10,836 | +2.4% |
| Transportation & warehousing | 65,257 | +3,744 | +6.1% |
| Professional, scientific, & technical services | 64,813 | +633 | +1.0% |
| Real estate & rental & leasing | 47,856 | +340 | +0.7% |
| Construction | 41,711 | +824 | +2.0% |
| Other services | 38,699 | +882 | +2.3% |
| Arts, entertainment, & recreation | 36,289 | +1,908 | +5.5% |
| Retail trade | 34,058 | -1,923 | -5.3% |
| Health care & social assistance | 31,404 | +1,734 | +5.8% |
| Admin. support & waste mgmt. svcs. | 31,089 | +664 | +2.2% |
| Educational services | 16,211 | +1,068 | +7.1% |
| Finance & insurance | 12,523 | +303 | +2.5% |
| Manufacturing | 7,753 | +239 | +3.2% |
| Wholesale trade | 6,756 | +163 | +2.5% |
| Accommodation & food services | 6,750 | +221 | +3.4% |
| Information | 5,869 | -24 | -0.4% |
| Agriculture, forestry, fishing & hunting | 5,700 | +59 | +1.0% |
| Utilities | 281 | +10 | +3.7% |
| Mining, quarrying, & oil & gas extraction | 162 | -9 | -5.3% |
| Source: U.S. Census Bureau, Nonemployer Statistics | |||
Looking back even further, not only has Minnesota's self-employment landscape expanded rapidly over the past 20 years, it has fundamentally reshaped itself. From 2003 to 2023, the state has added more than 104,000 net new nonemployer establishments, a 30% increase. Behind this growth are massive shifts across industries – some rapidly expanding, others steadily contracting – reflecting changes in consumer demand, technology and the organization of work.
Likewise, the release of new Nonemployer Statistics by Demographics (NES-D) data in May provides additional detail on the people behind Minnesota's nonemployer establishments, updated through 2022. The picture that appears is one of emerging opportunity, with self-employment spreading across age, gender and race.
An Industry on the Move
Fueled by changing consumer demands for speed and convenience, the market for ride-hailing and food delivery services has soared over the past five years. As such, Transportation & Warehousing surpassed 65,250 nonemployer establishments in 2023, making it the largest industry for self-employment in Minnesota for the first time ever. Between 2019 and 2023, the state gained 20,270 additional nonemployer establishments in Transportation & Warehousing, accounting for almost 60% of the state's total growth in self-employment during that time.
What is driving the growth? These platforms have created a new segment of "gig work" that is accessible, flexible and responsive to shifts in consumer demand. With minimal requirements beyond access to a vehicle and a smartphone, individuals can begin earning money within days, which represents a sharp contrast to the more traditional and cumbersome small business start-up process. This ease of entry has drawn a wide range of participants, from those looking to supplement their income during evenings or weekends to those seeking full-time earnings.
From an upside perspective, these opportunities provide flexibility where workers can set their own schedules and decide how much or how little to work. They also have low barriers to entry and immediate earning potential, often with payouts available daily or weekly. Individuals can log in and start driving, with apps available to provide customers. However, there are also notable downsides including uncertain earnings, where income can fluctuate widely depending on demand, location and competition. They often have high costs especially in vehicle expenses such as gas, maintenance, insurance and depreciation, as well as a lack of benefits such as health insurance, retirement contributions or paid leave.
The rise of these platforms highlights the evolving definition of self-employment, blurring the line between independent contractor and employee, and raising new questions about job security, benefits and long-term sustainability in this growing sector of the economy.
Not surprisingly, the vast majority (71%) of Transportation nonemployers are located in the 7-county Twin Cities metro area, including just over 30% in Hennepin County alone. Adding in the other metropolitan counties in Greater Minnesota (including Rochester, Duluth, St. Cloud, Fargo-Moorhead and more) in Minnesota pushes the total to 88% of the state's total, and those metro counties accounted for 93% of the state's growth from 2019 to 2023.
Of the 87 counties in the state, 56 added Transportation nonemployers over the year, and 65 gained since 2019. Only 2 of the 26 metro counties in the state saw a decline from 2019 to 2023, meaning the other 20 counties that lost Transportation nonemployers were located in Greater Minnesota (see Figure 1).
Figure 1. Location Quotient for Transportation & Warehousing Nonemployers by County in Minnesota, 2023

Source: U.S. Census Bureau Nonemployer Statistics
At a more detailed level, the Nonemployer Statistics data show that Couriers & Messengers alone grew by more than 22,000, a nearly 600% increase since 2003, while Taxi & Limousine Services have added over 15,000 drivers over time. Long-distance General Freight Trucking nearly tripled as well. The rise of delivery platforms, app-based driving and independent freight haulers has made logistics the defining growth industry for Minnesota's nonemployer economy.
Across the Board
Other knowledge- and service-based sectors have also expanded significantly in recent years and over time. Long the largest industry for self-employment until being passed by Transportation in the most recent year, Professional, Scientific & Technical Services added nearly 17,000 establishments since 2003, a 35% increase, and had just under 65,000 establishments in 2023.
Likewise, Real Estate and Rental and Leasing continued to serve as a cornerstone of self-employment, adding more than 12,000 establishments since 2003. Growth was especially strong among lessors of real estate, which surged by nearly 10,000, and among property managers, which more than doubled. Like Transportation, this industry has also been aided by technology, as short-term and vacation rental platforms have expanded markedly over the past decade (see Figure 2).
Figure 2. Number of Nonemployer Establishments by Industry in Minnesota, 2006-2023

Source: U.S. Census Bureau Nonemployer Statistics
Within other categories, management and technical consulting more than doubled, while photographic services and translation and interpretation services both grew rapidly. The creative economy also flourished, with Independent Artists, Writers and Performers rising by more than 9,000 to total 21,900 establishments statewide. Motion picture and sound recording ventures nearly tripled, signaling an increasing number of Minnesotans finding opportunity through freelance creative work.
Health Care and Social Assistance told a more complicated story. Overall, the sector lost more than 1,000 nonemployers over the past 20 years, but beneath the surface, the mix shifted dramatically. For example, solo practices in mental health nearly tripled, adding almost 3,000 establishments. Home health care providers more than doubled, while "all other" health practitioners—ranging from alternative medicine to specialized therapies—also saw sharp increases. At the same time, declines in diagnostic labs, optometry and podiatry offset much of that growth. Perhaps most striking, child care services were cut in half, falling by more than 11,000 establishments, a 54% decline that has serious implications for families, employers and communities across Minnesota.
Retail trade as a whole contracted by more than 6,000 establishments, or 16%, but not every corner of retail moved in the same direction. Specialty food retailers surged by 249%, grocery and convenience stores more than doubled and automotive parts and tire dealers grew by 79%. Used merchandise, gift and other miscellaneous retailers remained substantial in 2023, even as traditional storefront categories like general merchandise and clothing stores struggled.
Similarly, in construction, residential building and equipment contractors expanded modestly, while heavy and civil engineering construction fell by more than half, including steep declines in land subdivision and highway construction.
Overall, Minnesota's nonemployer economy is not just larger than it was 20 years ago—it is fundamentally different. Growth has clustered around transportation, professional and creative services, real estate holding and management, specialty foods and emerging areas of health care, particularly mental health and home-based care. At the same time, long-established fields such as child care and retail trade have lost ground.
Demographic Differences
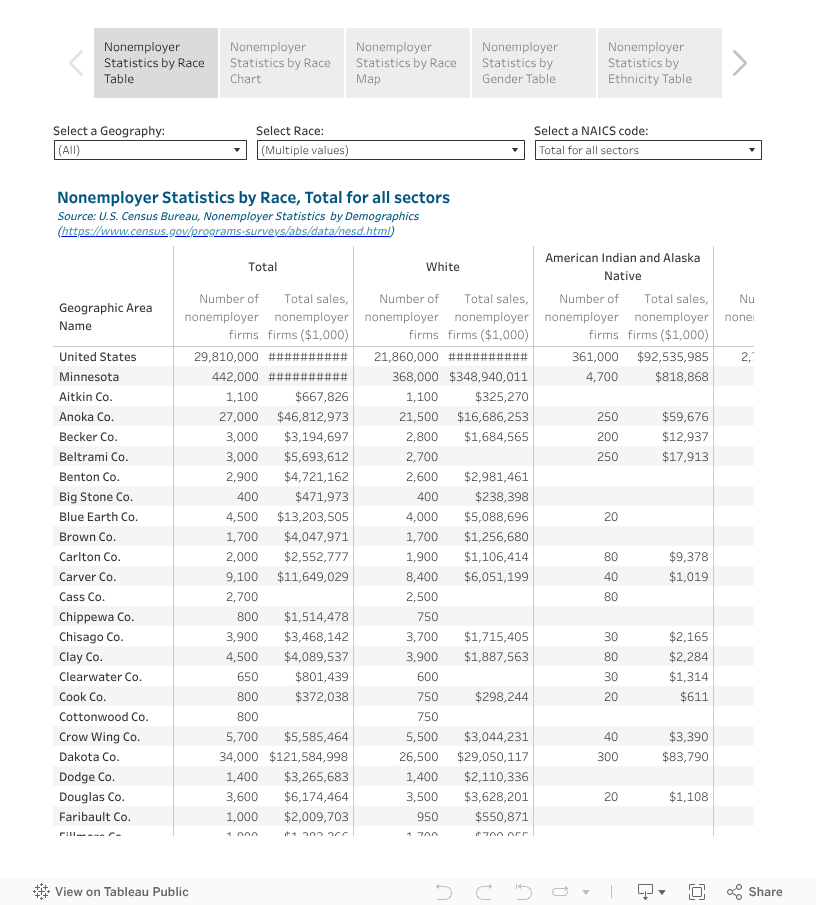
Census data also provides new insights into the people who are running these nonemployer establishments through the Nonemployer Statistics by Demographics dataset, detailing characteristics on race, ethnicity, veteran status, and gender. As the state's population and economy has grown, self-employment has increased across every race, ethnicity and gender over the past five years (see Table 2).
| Table 2. Minnesota Nonemployers by Race or Origin | |||||
|---|---|---|---|---|---|
| Number of Nonemployer Firms, 2022 | Sales of Nonemployer Firms ($1,000) | Change from 2017-2022 | Percent Change | Number of Nonemployer Firms, 2017 | |
| Total | 442,000 | $25,184,331 | +35,000 | +8.6% | 407,000 |
| White | 368,000 | $20,481,927 | +7,000 | +1.9% | 361,000 |
| Black or African American | 48,500 | $2,395,928 | +22,000 | +83.0% | 26,500 |
| American Indian or Alaska Native | 4,700 | $148,960 | +3,600 | +327.3% | 1,100 |
| Asian | 21,000 | $962,636 | +6,500 | +44.8% | 14,500 |
| Native Hawaiian or Pacific Islander | 550 | $21,386 | +400 | +266.7% | 150 |
| Hispanic (of any race) | 17,500 | $914,605 | +7,000 | +66.7% | 10,500 |
| Equally Hispanic/non-Hispanic | 450 | $61,671 | +150 | +50.0% | 300 |
| Source: U.S. Census Bureau Nonemployer Statistics - Demographics | |||||
With 368,000 nonemployer establishments, just over 83% of the statewide total are run by residents who identify as white alone, and that number increased by 7,000 people over the past five years. In comparison, the 48,500 nonemployer firms owned by Black or African American residents was nearly double the count in 2017, rising by 22,000 firms through 2022, and now accounting for 11% of the state's total. After adding 6,500 firms since 2017, just under 5% of nonemployer establishments are owned by Asian Minnesotans, and 1.1% of the state's nonemployers are owned by Native Americans after quadrupling in the past five years. The state also has 17,500 self-employed Hispanics across all race groups, which was a 66.7% increase.
Interestingly, white Minnesotans owned more than 85% of the nonemployer establishments in 15 of the 18 industry categories, including 100% of the firms in both Mining and Utilities, though that was just 150 and 250 firms, respectively. In contrast, white owners accounted for just 50% of the nonemployer firms in Transportation & Warehousing, meaning that not only was it the primary driver of growth in self-employment in the state, but it was also the primary growth option for workers of races other than white, especially for Black or African American residents. The other two industries with more racial diversity in ownership include Accommodation & Food Services and Health Care & Social Assistance (see Figure 3).

In 2022, women owned about 178,000 nonemployer firms in Minnesota, roughly 40% of the total, compared to the U.S. as a whole, where women accounted for 43% of nonemployers. However, the concentrations of female ownership varied greatly by industry, ranging from a low of 10% of the nonemployer establishments in Construction to a high of 78% in Health Care & Social Assistance. Other industries with high numbers of self-employed females included Educational Services, Retail Trade, Other Services and Administrative Support & Waste Management Services.
In contrast, industries where males were more likely to be self-employed included Construction, Agriculture, Utilities, Mining and Transportation & Warehousing. Real Estate, Rental & Leasing had the highest share of ownership that was split equally between male and female (see Table 3).
| Table 3. Minnesota Nonemployers by Gender and by Industry, 2022 | Total | Female | Male | Equally Male/Female |
|---|---|---|---|---|
| Total for all sectors | 442,000 | 40.3% | 55.7% | 2.7% |
| Agriculture | 5,600 | 17.0% | 80.4% | 1.6% |
| Mining | 150 | 20.0% | 66.7% | 13.3% |
| Utilities | 250 | 20.0% | 80.0% | 0.0% |
| Construction | 41,000 | 10.2% | 86.6% | 1.3% |
| Manufacturing | 7,500 | 32.0% | 62.7% | 3.3% |
| Wholesale trade | 6,600 | 34.8% | 60.6% | 2.3% |
| Retail trade | 36,000 | 58.3% | 38.9% | 1.5% |
| Transportation & Warehousing | 61,500 | 24.4% | 74.8% | 0.3% |
| Information | 5,900 | 32.2% | 64.4% | 1.4% |
| Finance & Insurance | 12,000 | 25.0% | 71.7% | 1.7% |
| Real Estate & Rental & Leasing | 47,500 | 25.3% | 51.6% | 17.3% |
| Professional & Technical Services | 64,000 | 44.5% | 53.9% | 1.0% |
| Admin. Support & Waste Mgmt. Svcs. | 30,500 | 52.5% | 45.9% | 0.7% |
| Educational Services | 15,000 | 61.3% | 39.3% | 0.3% |
| Health Care & Social Assistance | 29,500 | 78.0% | 22.0% | 0.3% |
| Arts, Entertainment & Recreation | 34,500 | 42.0% | 56.5% | 0.6% |
| Accommodation & Food Services | 6,500 | 47.7% | 47.7% | 3.8% |
| Other Services | 38,000 | 55.3% | 42.1% | 1.2% |
| Source: U.S. Census Bureau Nonemployer Statistics - Demographics | ||||
A Path Forward
Minnesota's nonemployer economy continued to expand in 2023, adding roughly 10,800 establishments to reach about 453,000 self-employed businesses – capping a rebound of nearly 43,800 since the pandemic dip in 2020. Over the longer arc, the state has accumulated more than 104,000 additional nonemployer firms since 2003, about a 30% gain, indicating that self-employment is not only larger than two decades ago but also structurally different.
The biggest boom is in Transportation & Warehousing, which climbed past 65,000 nonemployer establishments in 2023 and became the state's largest self-employment industry for the first time. Since 2019 it has accounted for nearly three-fifths of statewide growth, offering opportunities to a wide variety of workers due to low barriers to entry, schedule control and rapid access to earnings. However, there are also challenges including volatile demand and vehicle and insurance costs borne by the worker.
Beyond Transportation, the map of self-employment shifted in other ways: Professional & Technical Services remain sizable after steady gains; Real Estate holding and property management grew alongside short-term rentals; and creative fields expanded; while segments such as child care and parts of Retail Trade contracted.
Demographically, ownership broadened across race, ethnicity and gender between 2017 and 2022. In Minnesota, white ownership still constitutes the majority overall, but growing industries like Transportation show a much more diverse profile, and women now run about two in five nonemployer firms, with especially high concentrations in areas like Health Care and Education.
As the world of work continues to change and people value their independence, self-employment will continue to be a viable option for workers in Minnesota, either as gig work or as a primary source of income. Tracking these changes provides insight into how Minnesota's economy is reorganizing – where new opportunities are emerging, which sectors are losing ground and what skills and supports workers will need to succeed.