-
Unemployment
The unemployment rate increased to 4.1% in Minnesota in December, on a seasonally adjusted basis.
The number of unemployed increased to 131,525 workers and the number of employed decreased to 3,038,526 workers. The labor force grew to 3,170,051 workers, and the state's labor force participation rate remained level at 68.2%.
The U.S. unemployment ticked down to 4.4% in December, on a seasonally adjusted basis. The nationwide labor force participation rate decreased to 62.4%.
| Unemployment Rates |
|
December
2025 |
November
2025 |
December
2024 |
| Minnesota |
| Seasonally Adjusted |
4.1% |
4.0% |
3.0% |
| Not Seasonally Adjusted |
4.3% |
3.9% |
2.6% |
| United States |
| Seasonally Adjusted |
4.4% |
4.5% |
4.1% |
| Not Seasonally Adjusted |
4.1% |
4.3% |
3.8% |
Select this link for more data
Download monthly analysis of current release
-
Monthly Employment
Minnesota’s monthly job growth was flat in December as the state held steady at 3,068,500 jobs (0.0% growth).
Eight of eleven published supersectors posted positive growth. Mining and Logging added 100 jobs, Manufacturing added 2,200 jobs, Financial Activities added 200 jobs, Professional and Business Services added 3,700 jobs, Education and Health Services added 900 jobs, Leisure and Hospitality added 700 jobs, Other Services added 800 jobs and Government added 1,700 jobs.
Two supersectors posted decreases. Construction lost 9,900 jobs and Trade, Transportation and Utilities lost 400 jobs.
Information employment was flat.
U.S. total payroll employment was up slightly in December, adding 50,000 jobs or 0.0%. Private sector employers added 37,000 jobs (0.0%) on a seasonally adjusted basis. Minnesota outperformed the nation in five supersectors.
| Payroll Employment |
| Sector |
December 2025 - Seasonally Adjusted |
| Minnesota |
U.S. |
Number of Jobs
Gained or Lost |
Percent
Change |
Percent
Change |
| Total Nonfarm Employment |
0 |
0.0 |
0.0 |
| Total Private |
-1,700 |
-0.1 |
0.0 |
| Mining & Logging |
100 |
1.5 |
-0.3 |
| Construction |
-9,900 |
-6.6 |
-0.1 |
| Manufacturing |
2,200 |
0.7 |
-0.1 |
| Trade, Transportation, & Utilities |
-400 |
-0.1 |
-0.1 |
| Information |
0 |
0.0 |
0.0 |
| Financial Activities |
200 |
0.1 |
0.1 |
| Professional & Business Services |
3,700 |
1.0 |
0.0 |
| Educational & Health Services |
900 |
0.1 |
0.1 |
| Leisure & Hospitality |
700 |
0.3 |
0.3 |
| Other Services |
800 |
0.7 |
0.1 |
| Government |
1,700 |
0.4 |
0.1 |
Select this link for more data
Download monthly analysis of current release
-
Annual Employment
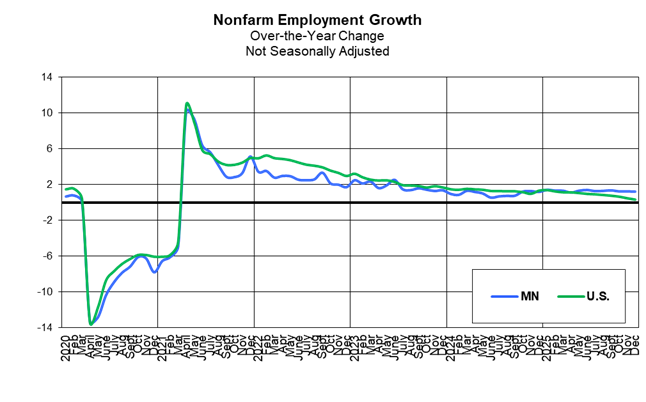
Minnesota over-the-year (OTY) payroll employment growth stood at 37,143 net new jobs or 1.2%, slightly lower than November’s 1.3% OTY gain. The private sector added 37,315 jobs, or 1.4% in December, which was lower than November’s 1.5% gain.
U.S. total nonfarm over-the-year job growth stood at 0.3% in December, lower than November’s 0.5%. Private sector employment growth was at 0.5%, lower than November’s 0.7%.
Eight of eleven published supersectors in Minnesota added jobs over the year. Mining and Logging added 127 jobs (2%); Construction added 1,689 jobs (1.3%); Manufacturing added 5,838 jobs (1.8%); Trade, Transportation and Utilities added 3,311 jobs (0.6%); Professional and Business Services added 3,995 jobs (1.1%); Education and Health Services added 21,492 jobs (3.6%), Leisure and Hospitality added 3,255 jobs (1.3%); and Other Services added 1,928 jobs (1.7%).
In contrast, Information lost 1,786 jobs (4.1%), Financial Activities lost 2,534 jobs (1.3%), and Government lost 172 jobs (0.0%) over the year.
Nine supersectors showed strength over the year in Minnesota compared to the nation, as did Total Nonfarm, which was up 1.2% (versus 0.3% nationally). Mining and Logging was up 2% (versus -2.7% nationally); Construction was up 1.3% (versus 0.1%); Manufacturing was up 1.8% (versus -0.6%); Trade, Transportation and Utilities was up 0.6% (versus -0.3%); Professional and Business Services was up 1.1% (versus -0.4%); Education and Health Services was up 3.6% (versus 2.6%), Leisure and Hospitality was up 1.3% (versus 1.1%), Other Services was up 1.7% (versus 1%) and Government employment was flat (versus -0.7%).

Select this link for more data
Download monthly analysis of current release
-
Monthly Employment Analysis Reports
2025
December
November
October
September
August
July
June
May
April
March
February
January
2024
Annual Revisions
December
November
October
September
August
July
June
May
April
March
February
January
2023
December
November
October
September
August
July
June
May
April
March
February
January
2022
December
November
October
September
August
July
June
May
April
March
February
January
2021
December
November
October
September
August
July
June
May
April
March
February
January
2020
December
November
October
September
August
July
June
May
April
March
February
January