Career and Technical Education (CTE) is a term applied to educational programs/courses that integrate core academic knowledge with technical and occupational skills to provide students a pathway to postsecondary education and careers. Minnesota has a long history of offering CTE courses going back to 2007. Despite the availability of data on students CTE course-taking history since 2007, very few studies followed these students longitudinally from high school into post-secondary school and into the workforce.
 This article is the first in a series focused on analyzing the outcomes of Minnesota students who took CTE courses. The goals of this first article are to better understand the degree to which CTE was successful at facilitating both workforce entry and college enrollment and to identify which program features drive the most desirable outcomes so that school administrators, policy makers, and employers can invest more in what worked best.
Specifically, the study considers the following research questions:
- What kinds of Minnesota students participate in CTE the most?
- Did intensive participation in CTE, defined as taking 150 hours or more of CTE instruction, lead to similar rates of college completion compared to other students?
- Among males, did concentrating in CTE lead to better employment and earnings outcomes compared to other students?
- Which features of CTE courses appear to have a greater influence on male students' labor market outcomes?
The article starts with an overview of CTE participation patterns among 495,053 Minnesota high school graduates from 2009 to 2017, documenting the gender divide. It then delves into the post-high school educational and labor market outcomes of male students from the 2009-2015 cohorts. A separate article will be dedicated to female students.
Who takes CTE in Minnesota?
From 2007 to 2017 Minnesota public and charter schools offered a total of 1,105 courses defined as being part of a state-approved Career and Technical Education program. Rates of CTE participation during the study years were very high, with 80% of high school graduates taking at least one course in 9-12 grade. However, there is large variation in intensity of CTE participation across students. We distinguish between four levels of participation:
- Concentrators: students who took 150 hours or more of instruction (equivalent to 2 semester credits) in a single CTE career field.
- Explorers: students who took 150 hours or more of instruction overall, but less than 150 hours in a single CTE career field.
- Samplers: students who took less than 150 hours of CTE instruction overall.
- Non-participants: students who did not take any CTE courses in 9-12 grade.
Table 1 summarizes the main characteristics of the four groups in terms of size and hours of CTE instruction taken overall.
Table 1 – Levels of CTE participation in Minnesota at a glance
| Category of CTE participation | Students in each category | Share of total students | Avg number of hours of CTE instruction in 9-12 grade | |
|---|---|---|---|---|
| Intensive CTE | Concentrators | 198,853 | 39% | 441 |
| Explorers | 71,856 | 15% | 231 | |
| Low intensity or no CTE | Samplers | 126,450 | 26% | 86 |
| Non-participants | 97,893 | 20% | 0 | |
| Total, cohorts 2009-2017 | 495,053 | 100% | 231 | |
| Source: Author's calculations based on data from the Statewide Longitudinal Education Data System (SLEDS) | ||||
Table 2 displays the same information as Table 1 broken down by gender, highlighting a strong gender divide in CTE.
Table 2 – Levels of CTE participation by gender
| Gender | Category of CTE participation, by gender | Share of total students | Avg number of hours of CTE instruction |
|---|---|---|---|
| Females | CTE Concentrators | 33% | 396 |
| Explorers | 14% | 226 | |
| Samplers | 29% | 83 | |
| Non-participants | 23% | 0 | |
| Total N, cohorts 2009-2018 | 247,715 | 186 | |
| Males | CTE Concentrators | 47% | 471 |
| Explorers | 15% | 236 | |
| Samplers | 22% | 90 | |
| Non-participants | 17% | 0 | |
| Total N, cohorts 2009-2017 | 247,337 | 277 |
First, males took more hours of CTE instruction on average, 277 versus 186 among females. Second, males were much more likely to be concentrators (47% versus 32% among females).
Students who took more hours in CTE (concentrators) were also slightly more likely to belong to categories who face potential barriers to access to post-secondary education, such as being from a low-income family and needing special education services (Figure 1). These students rely on CTE more than others as a way of boosting their employability prospects right after high school.
Figure 1
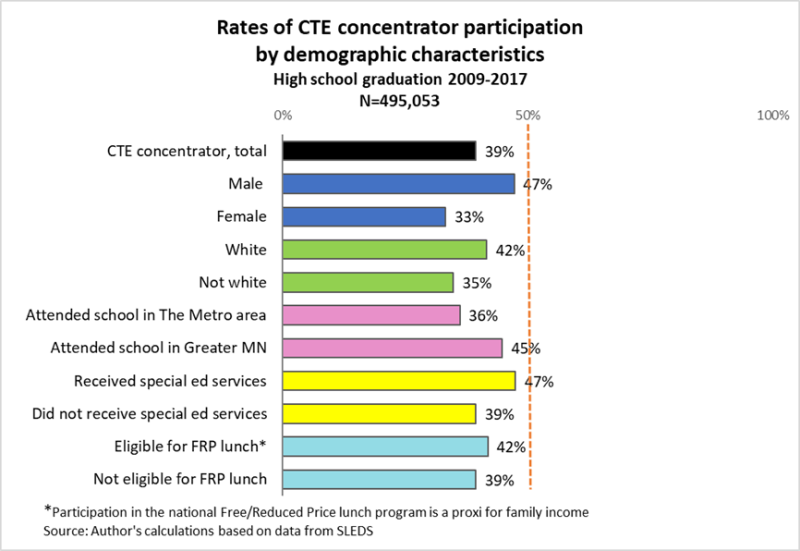
CTE concentrators were also more likely to be White (42% versus 35%), primarily as a result of the fact that school districts in Greater Minnesota, where whites comprise a relatively larger share of the resident population, have more CTE course offerings than school districts in the Twin Cities Metro.
Research Question 2: Did intensive CTE students have similar rates of college completion as other students?
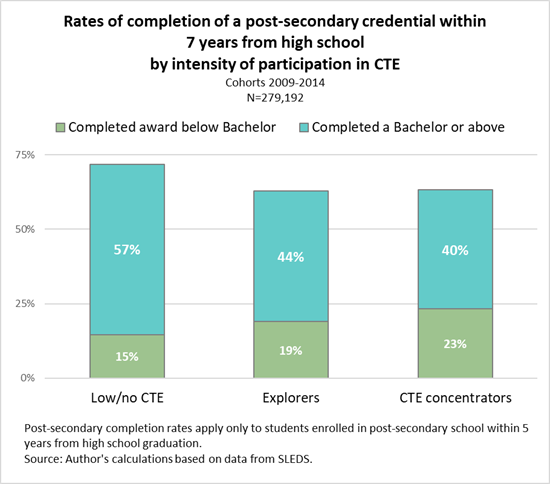
CTE concentrators were very similar to non-concentrators in the likelihood of enrolling in post-secondary school. The post-secondary enrollment rate was 81% among CTE concentrators versus 85% among non-concentrators. We find, however, a big difference between groups when it comes to completing a credential. Figure 2 shows that the low/no CTE group had higher educational attainment than explorers and concentrators both in terms of overall completion rates (72% versus 63%) and in terms of completion of a Bachelor or higher credential (57% versus 44% among explorers and 40% among concentrators).
Figure 2
Since the two characteristics most strongly associated with CTE participation intensity are gender and special education status, the remainder of the article will focus only on males who did not receive special education services in 11th or 12th grade1, while a second upcoming article will focus on females. This separate analysis will allow us to pinpoint the effects of CTE participation on educational and labor market outcomes.
Research Question 3: Among males, did CTE concentrator status lead to better employment and earnings outcomes relative to other students?
It is possible that students who completed many hours of high school CTE could have experienced a good outcome in terms of achieving their career goals and earning good wages even without finishing a credential. Therefore, students' medium-term labor market outcomes are an important benchmark for measuring success. Our analysis will focus on two such metrics: median hourly wages, representing students' earnings potential; and rates of full-time year-round employment, representing job quality2. These metrics must be tracked for at least six years after graduation to allow college-bound students to finish a four-year degree3.
Figure 3 displays work status and wages during the first seven years after high school graduation comparing low/no CTE with CTE explorers and concentrators. The bars represent the share of employed individuals who were working full-time for the entire year. Explorers and concentrators start with slightly taller bars in Year 1 than the low/no CTE group, indicating a faster transition into the workforce. The increase in full-time year-round employment was accompanied, for all groups, by a steady increase in hourly wages, but CTE concentrators earned more and had better job stability in each of the years. Explorers, in contrast, lost their earnings advantage in the 6th year.
Figure 3
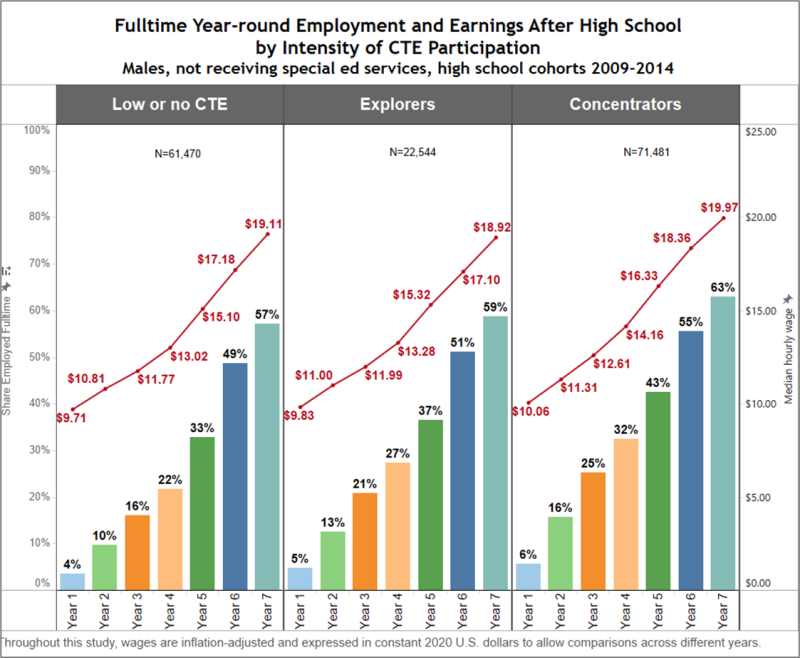
From this we conclude that in the medium-term the labor market benefits of participating in CTE accrue to concentrators, not to other types of CTE participants.
Research Question 4: Which features of CTE courses drive outcomes? First mechanism: concentrating
Which specific CTE course features could be driving the differences in labor market outcomes between the three types of participation in CTE documented in Figure 3?
There are at least four features/mechanisms through which participation in CTE can influence labor market outcomes:
- Taking 150 or more hours in a specific career field rather than across multiple fields;
- Choosing courses intended to prepare for an in-demand occupation or industry;
- Completing a post-secondary credential;
- Entering an industry related to the high school CTE field of study.
The remainder of the article will explain each mechanism in detail.
The first mechanism driving positive outcomes, as shown in Figure 3, is being a CTE concentrator. To understand why this provides the greatest labor market outcomes benefit, let's compare a course in "Introduction to Baking" with one in "Chef's Training/Work Experience Part III". The first course is only introductory, while the second belongs to a sequence and incorporates hands-on work experience. Since concentrators are more likely than others to attend courses of the second type, they take full advantage of coherent course sequences geared towards developing occupational competencies, as well as of opportunities to gain real world job experience.
Do the benefits of concentrating accrue mainly to students with post-secondary schooling? If that were the case, concentrators would still need to invest in some kind of post-secondary schooling. To answer the question, Figure 4 compares concentrators to non-concentrators breaking down the results from Figure 3 by four post-secondary educational attainment levels. We find that concentrators had consistently higher wages and full-time year-round employment six years after high school graduation regardless of differences in educational paths after high school.
Figure 4
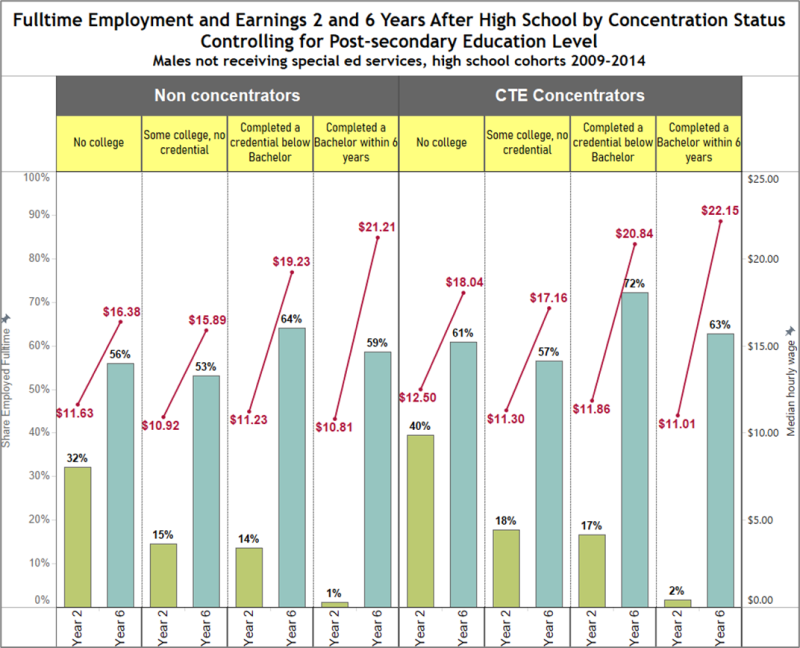
In general, regardless of education level, concentrators outperformed other students. CTE is doing its strongest work in the "no college" category, where concentrators had higher rates of full-time year-round employment in the second year (40% versus 32%) and higher wages, indicating a quicker and more effective workforce entry. By the sixth year, concentrators still held an advantage both in full-time year-round employment (61% versus 56%) and in wages ($18.04 versus $16.38). Furthermore, and also important, the wage premium for concentrators holds even after controlling for location of work across the six Minnesota Planning Regions4.
These findings are encouraging especially given the fact that concentrators did less well than non-concentrators in standardized tests administered in 8th grade5, indicating that their academic preparation may not have allowed some of them to succeed in a four-year college. Concentrating in CTE appears to have been a good alternative for male high school graduates who were not considered prepared for, were not interested in, or could not afford to complete a four-year credential.
Research question 4, Second mechanism: Choice of field of concentration
The second important mechanism driving outcomes is the topic, or field of study, of the CTE course where students took most hours. Figure 5 demonstrates the power of this mechanism by taking the same data displayed in Figure 6 for concentrators and breaking it down between those who took courses in the skilled trades and those who did not. Concentrators who focused in the trades (Construction, Repair and maintenance, Precision production, Engineering/engineering technologies, or Agricultural mechanization) had higher wages and job stability compared to other students regardless of differences in post-secondary educational paths.
Figure 5

The wage premium is particularly pronounced in the "no college" group, where, after six years, skilled trades course participants earned $2.09 an hour more than others ($19.10 versus $17.01, an 11% difference). For college-age individuals6 this is a large premium.
There is also a significant wage premium for individuals who concentrate in skilled trades CTE and then complete a sub-baccalaureate credential. It is worth adding that a growing number of employers - especially in manufacturing – recruit job applicants by offering tuition reimbursement to earn a sub-baccalaureate credential in the skilled trades. Therefore, it is very likely that some of the 4,813 students shown in Figure 7 in the "below Bachelor" category obtained a college education for free or at a discount while working in a related industry. And their earnings outcomes were better than those of non-concentrators with equivalent education but who did not specialize in the skilled trades.
The finding that raises some concern is the large group - 11,298 - of concentrators who did not focus on the skilled trades, delayed workforce entry (as shown by their low shares of full-time year-round employment in Year 2) presumably to attend college, but then dropped out within 6 years without a credential. Their labor market outcomes are worse than other concentrators, but still better than their non-concentrators peers displayed in Figure 4.
There is more to the success of concentrators than field of study alone, but CTE courses in the skilled trades are worth highlighting as examples of what worked best for male students.
An important policy implication of this finding is that more students should be encouraged to take CTE in the skilled trades. One way of achieving this goal would be to expand participation of underrepresented students, especially non-white and female students. The gender divide has already been documented in Table 2, but a racial divide also exists. Among all CTE course takers (including samplers) from 2007 to 2015, White and American Indian students had the highest rates of participation in skilled trades CTE (18%), while students from other races/ethnicities were less represented7.
Research Question 4, Third mechanism: Completing a post-secondary credential
One of the main critiques of traditional vocational education, which led to its replacement with CTE, was that it tracked certain categories of students away from college and restricted their future choices by building an excessively narrow skills set in high school. CTE programming needs to strike a delicate balance between serving the needs of students who do not plan to go to college while also offering them a path towards a college education if they choose to take it, and at the same time offering everyone else an opportunity to explore careers and majors to make better informed post-secondary educational choices and find a path into the workforce if at any point they choose a career that does not require a college degree.
Were CTE concentrators successful in a variety of paths after high school, including college? And to what extent were their wages higher when they completed a credential? Table 3 documents educational and wage outcomes broken down by the six largest CTE fields of study. For reasons of space, we excluded from the display fields of study in which fewer than 2,900 male students concentrated during the study years. Post-secondary educational outcomes represent all concentrators8, while wage outcomes represent only those employed in Minnesota six years after high school9.
Table 3 - Educational and earnings outcomes among male CTE concentrators by CTE field in which they took the most hours, High school cohorts 2009-2014
| Field of study of concentration | Educational outcomes within 7 years from high school | Share within field of study | Number employed in MN six years after high school | Hourly wages in Year 6, MN workers only* |
|---|---|---|---|---|
| TOTAL | No college or did not complete | 49% | 25,221 | $17.28 |
| Completed a credential of any kind | 51% | 23,158 | $20.64 | |
| Total | 100% | 48,379 | $18.81 | |
| Business**
N=19,256 |
No college or did not complete | 40% | 4,766 | $16.58 |
| Credential below Bachelor | 13% | 1,476 | $18.70 | |
| Bachelor or above | 48% | 5,753 | $21.45 | |
| Total | 100% | 11,995 | $18.81 | |
| Construction, repair, and precision production
N=18,350 |
No college or did not complete | 56% | 6,914 | $18.58 |
| Credential below Bachelor | 26% | 3,420 | $21.45 | |
| Bachelor or above | 18% | 2,029 | $20.97 | |
| Total | 100% | 12,363 | $19.67 | |
| Agriculture
N=4,917 |
No college or did not complete | 50% | 1,610 | $17.82 |
| Credential below Bachelor | 26% | 867 | $20.35 | |
| Bachelor or above | 24% | 660 | $19.92 | |
| Total | 100% | 3,137 | $18.95 | |
| Engineering and engineering technologies
N=4,594 |
No college or did not complete | 39% | 1,115 | $16.75 |
| Credential below Bachelor | 14% | 412 | $19.71 | |
| Bachelor or above | 47% | 1,247 | $24.13 | |
| Total | 100% | 2,774 | $19.41 | |
| Visual arts
N=3,677 |
No college or did not complete | 50% | 1,228 | $16.22 |
| Credential below Bachelor | 15% | 333 | $18.38 | |
| Bachelor or above | 35% | 770 | $18.97 | |
| Total | 100% | 2,331 | $17.33 | |
| Audio-video technologies and web graphics***
N=2,978 |
No college or did not complete | 53% | 1,029 | $15.66 |
| Credential below Bachelor | 14% | 245 | $17.12 | |
| Bachelor or above | 33% | 567 | $19.63 | |
| Total | 100% | 1,823 | $16.56 | |
|
*Students who were attending post-secondary school six years after high school graduation were excluded from the wage calculation in order to prevent college-going students working part-time, in some fields more than in others, from biasing the results. ** The Business field of study corresponds almost exactly to the Business career cluster. Other fields of study included in this table, however, do not have an exact correspondence with a CTE cluster because they have been defined on the basis of the CIP (Current Instructional Program) code of the course. ***These programs correspond to CIP codes 09 and 10 combined. |
||||
The biggest takeaways from this analysis are:
- Approximately 51% of CTE concentrators went on to complete a post-secondary credential10.
- All CTE fields of concentration led to at least 18% of students completing a Bachelor (or higher credential) within seven years from high school exit, suggesting that every CTE field of study among those represented in the chart appealed to students aspiring to pursue a four-year degree, and CTE is not a path away from college. The field with the highest Bachelor attainment rate was Business at 48% followed by Engineering/engineering technologies at 47%.
- The low rates of post-secondary attainment in Construction/repair/precision production (56% without any credential) and in Agriculture (50%) are not a bad outcome considering the high wages among non-completers. There is a chicken-and-egg phenomenon at play here: if students do not expect to earn a wage premium through completion of a credential, they won't see a reason for enrolling or staying in school to finish it. These programs have lower rates of post-secondary completion precisely because they are so effective at preparing students for immediate workforce entry in high-demand fields.
- In fields like Visual arts and Audio-video technologies the earnings of non-completers - between $15.66 and $16.22 an hour - fall well below the living wage11, suggesting that high school CTE was not enough to help students enter gainful careers.
- On the other hand, when CTE coursework is combined with a post-secondary credential, even at the sub-baccalaureate level, wages get a boost in every field.
The challenge, therefore, is that some CTE courses - fortunately attracting fewer students - tend to have a low stand-alone value and would need to be paired with some post-secondary schooling to achieve a living wage. The benefit of aligning secondary and postsecondary programs is that a sub-baccalaureate credential is often enough to boost employability and earnings.
An important policy implication of these findings is the need to invest more in high school career counseling resources so that students take advantage of post-secondary programs where their high school CTE experiences can be leveraged. Students should also be warned that certain CTE pathways pay off primarily if paired with a sub-baccalaureate or higher credential, while others will allow them to earn a living wage even if they later decide not to finish college.
Research Question 4, Fourth mechanism: Entering industries related to the CTE field of concentration
Did CTE concentrators enter employment within an industry related to the CTE field in which they concentrated? And further, did they earn a living wage in the job? First, we present industries of employment comparing CTE concentrators to all other students (Figure 6); then we look at industry of employment among concentrators breaking down the results by CTE field of study (Figure 7).
As expected, CTE concentrators attain higher wages overall than other students six years after high school, $18.81 versus $17.69 (Figure 6). These wage differences are even bigger if we consider that concentrators are much more likely to be employed in Greater Minnesota, where wages are typically lower.
Figure 6
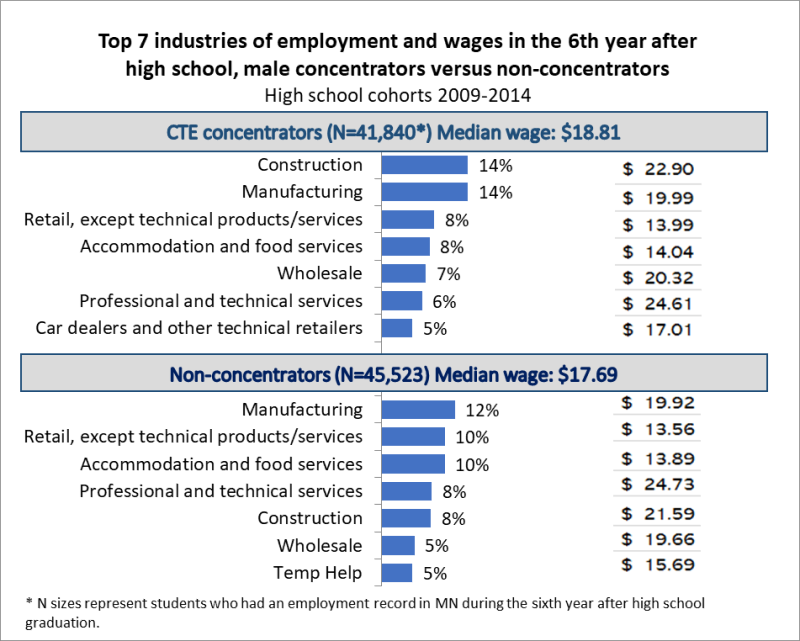
The single most important factor driving higher earnings is the mix of industries where concentrators became employed. A very high share (45%) found jobs in technical industries: Construction, Manufacturing, Wholesale, Professional and technical services, and technical retailers such as car dealers, tire stores, and building material supply stores. Wages in these industries are higher overall because skills requirements are higher12. CTE concentrators are evidently a good fit for the more technical industries. Non-concentrators, in contrast, had lower shares of employment in these industries, especially in Construction, and in most cases earned less than concentrators even within the same industry, a signal of lower productivity.
This evidence suggests that, at least among male students overall, CTE programs lived up to the promise of developing technical skills leading to industry-readiness, either alone or in combination with post-secondary credentials.
Figure 7 delves deeper into these results for concentrators, breaking them down by detailed field of study to see if the wage premium for concentrating varies by field and is higher in industries related to the CTE field of concentration. Since most fields of study correspond to an industry or groups of industries, this analysis provides a straightforward measure of the relationship between CTE participation and the rate of job placement in industries aligned with the area of concentration. Furthermore, the direct comparability between the data shown in Figure 7 and that shown in Table 3 helps us gauge the role that both mechanisms – post-secondary schooling and industries of employment - played in influencing earnings outcomes within each field of study.
Figure 7
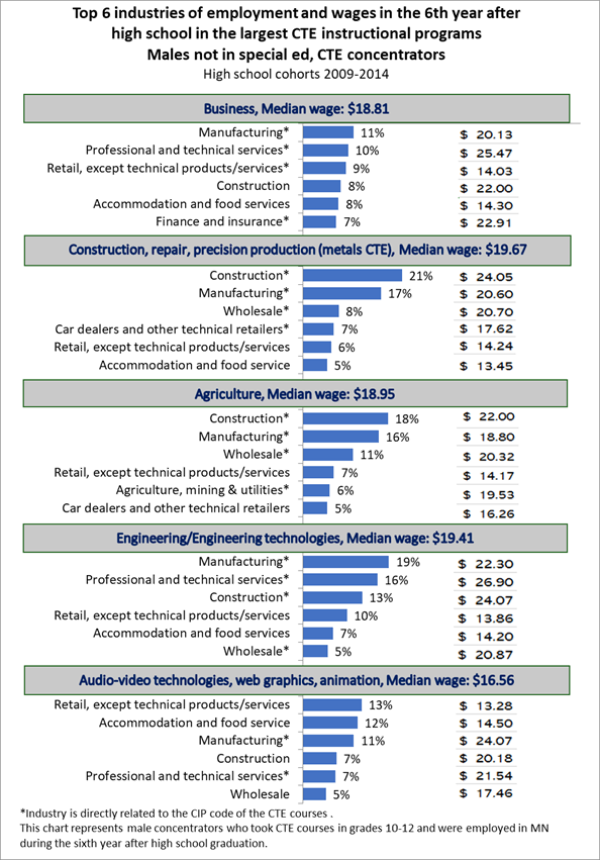
The largest field of study, Business, led relatively often to employment in industries well aligned with a background in business such as Manufacturing, Professional and technical services, and Finance and insurance. However, wages in certain leading industries were very low, signaling that some students were not able to secure a living wage six years after high school. The diverse mix of courses in this large field of study deserves to be investigated in detail in future research to help identify what worked best.
The Construction/repair/precision production field of study is the most successful at boosting career readiness. Wages were the highest of all CTE fields, with a median of $19.67 an hour. CTE course-taking can be largely credited for this success because the majority of participants (56%) did not obtain a post-secondary credential, and only 18% earned a four-year degree (see Table 3). High wages, together with the close connection between the top industries of employment and the focus of these programs, indicate excellent alignment between the skills of employees and the skills sought by employers. This is not at all surprising given that in fields like construction and precision production (welding, machining, machine tool technology, also referred to as "metals CTE") employers have reported shortages for many years13 consistently indicating that skills acquired on the job are harder to find and more valued than post-secondary credentials. In these fields, high school CTE represents a critically important talent pipeline.
Other high performing fields of study are Agriculture and Engineering/engineering technologies, all leading predominantly to employment in related industries such as Agriculture, Wholesale (which includes trading farm products), Manufacturing, and Professional and technical services. Course delivery method is partially driving these results, too, especially in the Agriculture field of study where CTE courses tend to have a greater emphasis on work-based learning in the form of apprenticeships or Supervised Agricultural Experiences. The opportunity to gain real world job experience appears to have improved participants' job prospects right out of high school14.
Confirming results from Table 3, the Audio-video technologies and web graphics field of study led to the lowest wages among these fields six years after high school. Figure 9 helps unpack this finding further by showing that participants became employed predominantly in industries with the lowest skill requirements: Retail except technical products (13%) and Accommodation and food services (12%). Students who found jobs in related industries such as Professional and technical services were highly compensated, but they were the minority15. We know from Table 3 that concentrators in these programs had low post-secondary attainment. It appears, therefore, that these courses failed to meet both the career-readiness and the college-readiness goals of CTE.
These courses are very popular: about 23,000 male students took at least one from 2007 to 2015. Reasons for the popularity? Learning cool stuff, from broadcasting to animation and video-game design. However, taking too many of these courses was not beneficial, probably because the over-supply of these skills made them less valuable to employers. If the number of job openings requiring high amounts of these skills are too few compared to the number of people possessing the skills, many workers will be pushed to positions of lower responsibility or entry level positions in unrelated fields. For instance, if more individuals take CTE graphic design courses than the local number of job openings for graphic designers, relatively more individuals will become clerks than graphic designers. This raises questions about the wisdom of investing in such a broad selection of CTE courses leading to skills sets that are not in demand, while courses designed to prepare for fields in higher demand - such as Health care - attracted fewer male students.
In general, we observe a strong connection between the fields of concentration in high school and industries of employment six years out. Although students could have developed these career interests even without CTE and could have developed industry-specific skills more through post-secondary school than through high school CTE, concentrating in CTE might have contributed to shaping students' choices. At the minimum, it might have helped them consolidate their initial preference for certain areas, leading to better informed career choices and more cohesive educational pathway trajectories.
Conclusions and Guidelines for Future Research
Participation in high school CTE in Minnesota is very strong, with 80% of high school graduates from 2009 to 2017 taking at least one course. However, no research has yet been conducted to analyze the labor market outcomes of CTE participants six and seven years after high school exit to see if they benefited from participating. This study, the first of a series aimed at filling this information gap, examines the medium-term workforce and educational outcomes of males who graduated from high school between 2009 and 2014, comparing CTE participants to other students.
We documented four main mechanisms of participation in CTE that have greater influence on students' labor market outcomes:
- Taking a coherent set of CTE courses in one specific field (concentrating). The labor market benefits of participating in CTE accrue to concentrators, or students who take at least 150 hours of instruction in one career field, not to other types of CTE participants. Concentrators had better job stability and earnings relative to other students up to seven years after high school. The other important and very encouraging finding is that the wage premiums associated with being a concentrator accrue even among those who did not enroll in college or enrolled and did not earn a credential. This opens up opportunities for youth who cannot or do not want to invest in college.
- Choosing an in-demand field of study. The topic or field of study of CTE courses where students took the most hours of instruction has a significant influence on labor market outcomes. CTE courses in Agriculture and Construction/repair/precision production boosted career readiness both in the short-term and in the medium-term, even without post-secondary schooling. This is good news, because for many years Minnesota employers have been struggling to fill job openings in these fields to replenish their talent pipelines as older workers leave the labor force. These dynamics will continue to create excellent employment opportunities for students interested in these fields.
- Earning a sub-baccalaureate credential: Despite the significantly lower rates of four-year degree completion among concentrators relative to non-concentrators, concentrators who did not complete any post-secondary credentials fared much better in the labor market relative to their peers who did not concentrate and did not complete a credential. When analyzing the educational and earnings outcomes of concentrators by CTE field of study, we found that programs well aligned with employer demand had a high stand-alone market value even without post-secondary credentials. Outcomes are, however, uneven across fields of study. Some fields of study did not lead to living wages unless paired with some post-secondary credentials. Fortunately, these fields of study attracted relatively fewer students. The good news is that overall, six years after high school a sub-baccalaureate credential was enough to attain median wages that exceed the Minnesota living wage.
- Finding a job in an industry related to the CTE field of study: Overall we found a strong connection between the CTE field of concentration and the industries where students become employed. Six years after high school, a very large share - 45% - of concentrators found jobs in technical industries like Construction, Manufacturing, Wholesale, Professional and technical services, and Technical retailers. This finding suggests that CTE programs lived up to the promise of developing technical skills that can lead to industry-readiness, either alone or in combination with post-secondary credentials. The relatedness between CTE field of concentration and industry of employment also suggests that participation in high school CTE played a role in students' decision making, guiding their college and career plans.
 Upcoming research articles will expand on these summary findings to determine how they might vary for different populations of students, school locations, and patterns of participation in rigorous high school courses besides CTE. Furthermore, future research will investigate the impact on labor market outcomes of completing a sub-baccalaureate credential in a field related to the high school CTE field of study.
In conclusion, this study found that high school CTE, during the selected time period and among male concentrators, has fulfilled its dual goal of facilitating transitions into the workforce while at the same time broadening the possibilities of post-secondary attainment at the sub-baccalaureate level. It created opportunities for non-college bound and/or academically under-prepared students to learn marketable skills while in high school. Moreover, it has been particularly effective at creating a pipeline of skilled workers for jobs that do not require a four-year degree.
While these descriptive findings are restricted to male students and cannot establish a causal relationship between positive labor market outcomes and high school CTE, they suggest that CTE is well positioned to prepare participants for the plentiful educational and employment opportunities that still exist in the middle of the skills spectrum, offering a good value to many young Minnesotans.
1Participation in special education services was evaluated in grades 11 and 12. Individuals who received special ed services before grade 11 but stopped receiving them in grade 11 were included throughout the study.
2Fulltime year-round employment is a proxy for job quality, including greater economic security, better opportunities for career advancement, and greater access to health care and retirement benefits.
3Six years is the Bachelor degree completion cutoff used by the U.S. Department of Labor. Therefore, it reasonable to assume that seven years after high school exit most students enrolled in a four-year degree have already completed it.
4Besides these descriptive findings, a supplementary analysis through an OLS regression model revealed that concentrators have significantly better earnings outcomes than any other group (explorers, samplers, and non CTE participants) six years after high school after controlling for a broad set of variables, including gender, race, eligibility for special ed services at any time in K-12, eligibility for free/reduced price lunch, English language learner status, high school graduation cohort, location of the high school, location of employment, and participation in special programs in high school (Adult Basic Education, Concurrent Enrollment, and PSEO). Males CTE concentrators still earn significantly more than others even after controlling for future post-secondary education, field of study of CTE courses taken, and industry of employment.
5The average 8th grade math score for male concentrators not in special ed, based on the MCA II math test, was 853.90 versus 857.28 among non-concentrators. The average 8th grade reading score for concentrators, based on the MCA II reading test, was 854.33 versus 857.84 among non-concentrators. Among concentrators, 66% were proficient in math (versus 74% among non-concentrators) and 69% were proficient in reading (versus 78% among non-concentrators). These statistics exclude 2009 high school graduates because they do not have 8th grade MCA scores.
6Six years after high school exit corresponds to an age of 24 for most students.
7Rates among Blacks, for example, were only 11% while those among Asians and Latinos were 16%.
8It might be misleading to assess the outcomes of a CTE field of study based on students who took very few hours of instruction in it.
9The reason for needing to use different samples is that students who left the state lack information on wages.
10These are not graduation rates, because they are expressed as a percentage of total students rather than as a percentage of total enrolled students. Therefore, these percentages are not directly comparable to those shown in Figure 2. We will refer to these measures as "attainment rates".
12There is a difference between technical and non-technical retail activities in the skills level required to perform the job. Technical retailers hire more specialized salespeople and repair/maintenance/installation workers, while other types of retailers tend to hire more cashiers or non-technical salespeople.
13See Leibert, A. Most In-Demand Skills in Manufacturing, MN Trends Magazine, Dec 2019.
14The work-based learning component of a course was tested in a regression model. The results showed that CTE participants, regardless of concentration status, who took courses with a work-based learning component had higher earnings than others holding other characteristics constant.
15It is also possible that students who chose to concentrate in these fields attended school districts that did not offer enough depth of CTE courses in other fields. Furthermore, these courses might have attracted students with relatively more challenging life circumstances, low motivation or low interest for any other career field compared to other students, and these unobserved factors affected their outcomes more than CTE coursework itself.

