The Growth and Impact of Minnesota’s Foreign-Born Workforce


by Carson Gorecki, Tim O'Neill and Amanda Blaschko
March 2025
Minnesota's Foreign-Born Population
Minnesota's foreign-born1 population has grown significantly over the past decade, reaching nearly 490,000 residents in 2023 and comprising 8.6% of the state's total population, according to the U.S. Census Bureau's American Community Survey2. This represents a 24.7% increase from 2013, highlighting the state's growing diversity and the important role immigrants play in Minnesota's demographic makeup. Additionally, foreign-born Minnesotans play an outsize role in the state labor force, relative to the total population. As of 2023, almost 11% of Minnesota's workers were immigrants.
While Minnesota's share of foreign-born residents (8.6%) remains below the national share of 13.9%, the state has seen more rapid growth in its immigrant population, with distinct patterns emerging between the Twin Cities metro area and Greater Minnesota. Among these foreign-born residents, 58.2% have become naturalized U.S. citizens, while 41.8% are not U.S. citizens.
Foreign-born population growth and settlement patterns vary significantly across the state. The seven-county Twin Cities metro area serves as the primary hub, housing 77.8% of the state's foreign-born population (380,516 residents). That is much higher than the 55% of the state's total population living in the region. The Twin Cities metro area has more established immigrant communities, with 38.6% having arrived before 2000, and this stability is reflected in the metro area's higher naturalization rate of 60.6%. In contrast, Greater Minnesota, which contains 22.2% of the state's foreign-born population (108,381 residents), has a different demographic profile with lower naturalization rates at 49.9%, and a larger share of recent arrivals, with 40.5% having entered since 2010.

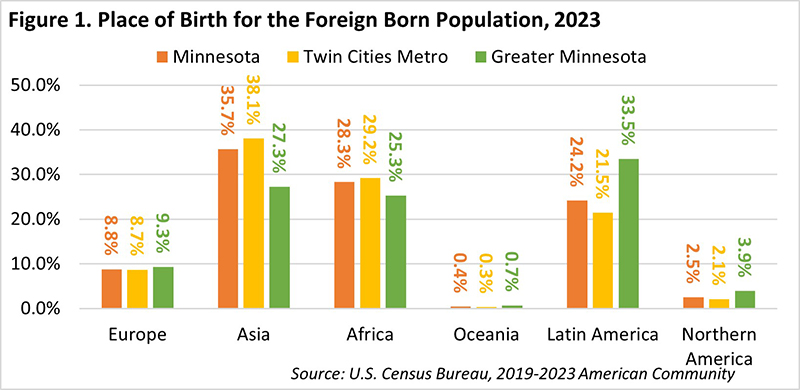
Looking at origin, Asia represents the largest share at 35.7% of foreign-born residents, followed by Africa at 28.3%, and the Americas at 26.7% (24.2% from Latin America and 2.5% from Northern America) (see Figure 1). This distribution differs notably from national patterns, where the Americas, particularly Latin America, represent over 50% of the foreign-born population.
Minnesota's African immigrant population has been particularly dynamic, showing the most dramatic growth with a 78.8% increase (+61,035 people) between 2013 and 2023. These patterns vary between the Twin Cities metro area and Greater Minnesota. The Twin Cities metro area shows a higher concentration of Asian immigrants (38.1%) and African immigrants (29.2%), while immigrants from the Americas make up 23.7% of the metro's foreign-born population - with 21.5% from Latin America and 2.1% from Northern America.
In contrast, Greater Minnesota shows a different pattern, with immigrants from the Americas comprising the largest share at 37.4% of the region's foreign-born population (33.5% from Latin America and 3.9% from Northern America), followed by Asia at 27.3% and Africa at 25.3%. The share of European immigrants remains similar between the Twin Cities Metro and Greater Minnesota at around 9%.
The age demographics of Minnesota's growing foreign-born population create valuable opportunities for the state's workforce. The foreign-born population is heavily concentrated in prime working ages, with 61.4% between the ages of 25 and 54 years, compared to just 38.2% of the total population in these age categories. This concentration is particularly pronounced in the 35- to 44-year-old age range, where foreign-born residents make up 24.1% compared to 13.4% of the total population. As Minnesota faces the challenges of an aging population, these demographic patterns position foreign-born residents as a vital source of current and future workforce growth.
The Growing Foreign-Born Workforce
As of 2023, more than 344,000 foreign-born workers accounted for 10.9% of the Minnesota's labor force (see Figure 3). The national foreign-born labor force (FBLF) share was higher, at 17.9%. Of the 43 states with foreign-born worker data available, Minnesota had the 24th highest share. Additionally, the foreign-born labor force participation rate (74.4%) was notably higher than the native-born participation rate (67.7%) in Minnesota.

From 2013 to 2023 every state saw its FBLF grow. Only four states saw their overall labor force grow faster than their FBLFs: Arizona, California, Nevada and Oregon. Between 2019 and 2023, the FBLF grew faster than the total labor force in all but nine states. Nationally, the FBLF (+7.0%) grew more than twice as fast as the overall labor force (+3.3%).
In 2013, the foreign-born worker share in Minnesota was 9.0% (see Figure 3). Since then, 74,450 foreign-born workers joined the labor force, equivalent to a 27.6% increase. Over the same period, the overall labor force added 151,400 workers, a 5.1% growth. Foreign-born additions accounted for nearly half of Minnesota's labor force growth from 2013 to 2023. Furthermore, Minnesota's foreign-born workforce grew 10.8 percentage points faster than the nation's over the last decade. Despite this robust numeric growth, the state retained its foreign-born workforce share ranking.
Our neighbors to the east and south have relatively smaller foreign-born labor forces. Both Iowa's and Wisconsin's foreign-born population account for around 7% (see Figure 3). Since 2013, Wisconsin's FBLF grew 20.3% and Iowa's increased 28.7%, while Minnesota's growth equaled 27.6%. Among other states, the fastest FBLF growth occurred in Indiana (+51%), Delaware (+47%), Utah (+42%) and Tennessee (+41%). On the low end were California (+2.2%), New York (+2.4%), Illinois (+3.9%) and Oregon (+5.4%).
Minnesota's FBLF growth over this period ranked 18th fastest in the U.S., representing a slow-down from the years following the Great Recession. From 2010 to 2015, Minnesota had the fastest growing foreign-born labor force in the nation at +23%, as more than 56,000 foreign-born workers joined. More recently, FBLF growth in Minnesota slowed. From 2019 to 2023, the state FBLF grew 6.2%, or an average of 1.5% per year. National FBLF growth remained relatively steady, ticking up a tenth of a percentage point during the 2019-2023 period to an annual average of 1.7%.

Foreign-Born Labor Force Characteristics
As was mentioned earlier, foreign-born residents are more likely to be in the labor force. Both nationally and in Minnesota, the foreign-born population has higher labor force participation. In Minnesota in 2023 the foreign-born labor force participation rate (FBLFPR) of 74.4% was six percentage points higher than the statewide labor force participation rate, which itself was the 6th highest among all states3. From 2013 to 2023, the FBLFPR increased while the overall LFPR decreased, meaning the labor force participation gap between the two groups grew in magnitude. In 2013, the average unemployment rate for the foreign-born workforce was 6%, more than two percentage points higher than the overall statewide rate. By 2023, this gap had closed to virtually zero as the foreign-born rate to fell to 2.2%, right above the 2.1% overall rate and within the margin of error.
Reflecting higher labor force participation, a higher share of foreign-born households recorded having earnings (90% vs. 79% of the total population), which are defined primarily as wages and salaries from employment. However, foreign-born households ($81,600) had lower median incomes than the total population ($85,100). Encouragingly, foreign-born median household incomes equaled 96% of the statewide median in 2023, up from 82% in 2013.
| Table 1. Select Economic Characteristics for Foreign-Born and Total Population in Minnesota, 2023 | ||
|---|---|---|
| Characteristic | Foreign-Born Population | Total Population |
| With Social Security income | 14.8% | 29.9% |
| With Supplemental Security Income | 4.8% | 3.7% |
| With cash public assistance income | 5.2% | 2.7% |
| With retirement income | 9.3% | 24.3% |
| With Food Stamp/SNAP benefits | 16.2% | 7.9% |
| No health insurance coverage | 12.0% | 4.2% |
| In renter-occupied housing units | 48.2% | 28.0% |
| Below poverty threshold | 13.8% | 9.3% |
| Carpooled to work | 15.1% | 8.0% |
| Public transit to work | 3.5% | 1.7% |
| Source: U.S. Census Bureau ACS, 1-yr Estimates | ||
Given that foreign-born residents are more likely to be of working age, immigrant households were about half as likely to receive social security income (14.8% vs. 29.9% of all households) and even less likely to have some sort of retirement income (9.3% vs. 24.3%).
Despite being more likely to have earnings, Minnesota's foreign-born population – when compared to the total population – was also more likely to be receiving cash public assistance and/or SNAP benefits. Just over 5% of foreign-born households had cash public assistance income and 16.2% were receiving food stamps or SNAP benefits in 2023 (see Table 1). By comparison, of all Minnesota households, 2.7% received cash public assistance income and 7.9% used food stamps or SNAP benefits.
Correspondingly, Minnesotan foreign-born residents had a higher poverty rate (13.8%) than the total population (9.3%). Finally, 12% of foreign-born residents were without health insurance, compared to 4.2% of the total population. Perhaps reflective of the population's concentration in the metro, foreign-born workers were less likely to drive alone to their jobs and about twice as likely to carpool or take public transportation. Foreign-born residents were also more likely to occupy rental housing units (48.2%) than the total population (28%).
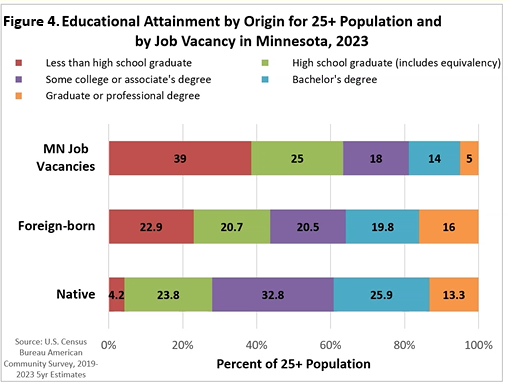
The educational attainment of Minnesota's foreign-born population also shows varying levels of alignment with current job market demands, according to DEED's Job Vacancy Survey. Among foreign-born residents 25 years and older, 35.8% hold a bachelor's degree or higher (with 16% holding advanced degrees), while 20.5% have some college or an associate's degree, 20.7% are high school graduates, and 22.9% have less than a high school education (see Figure 4).

According to the 2023 Job Vacancy Survey results, Minnesota's job openings span across various educational requirements, with 19% of vacancies requiring a bachelor's degree or higher, 11% requiring an associate degree, 7% requiring vocational training, 25% requiring a high school diploma or GED, and 39% having no formal education requirement. As Minnesota's workforce continues to age and retire, foreign-born workers across all education levels are positioned to help fill critical vacancies.
With nearly two-thirds of current openings requiring a high school diploma or less, and many others requiring higher education, foreign-born workers bring valuable skills and experience that align with the state's diverse labor market needs. Their participation is becoming increasingly crucial in industries facing persistent labor shortages, offering a vital solution to the state's evolving workforce needs.
Foreign-Born Industry and Occupational Employment in Minnesota
The U.S. Census Bureau's American Community Survey's (ACS) 5-year estimates can provide insights into Minnesota's foreign-born employment distribution by industry and occupational employment. This data zeroes in on the civilian employed population 16 years of age and older. Of that population, about one-in-nine of the state's total workforce was foreign-born in 2023.
Broken down by industry sector, Education & Health Services employed the most foreign-born workers in Minnesota. In fact, with more than 83,800 such workers in 2023, over one-quarter (26.1%) of the state's total foreign-born workforce worked in this sector. Manufacturing, with over 65,500 foreign-born workers, accounted for another fifth (20.1%) of the state's total foreign-born workforce. Coming in third with nearly 37,900 foreign-born workers, Professional & Business Services accounts for just over one-ninth (11.8%) of the state's total foreign-born workforce. Altogether, Education & Health Services, Manufacturing and Professional & Business Services accounted for over 186,200 foreign-born workers in 2023, or about three-fifths (58.0%) of the state's total foreign-born workforce. Retail Trade; Leisure & Hospitality; Financial Activities; and Transportation, Warehousing, & Utilities each had over 20,000 foreign-born workers, with both Construction and Other Services each accounting for over 10,000 foreign-born workers (see Figure 5).

Where foreign-born workers make up a significant share of total industry employment in Minnesota, they are especially concentrated in Manufacturing (16.0% of the industry's total employment); Transportation, Warehousing, & Utilities (13.5%); and Professional & Business Services (12.1%). Foreign-born workers are less concentrated in Public Administration (6.4% of the industry's total employment), Information (6.7%), Construction (7.3%), Retail Trade (7.8%), Natural Resources & Mining (8.0%) and Wholesale Trade (8.2%).
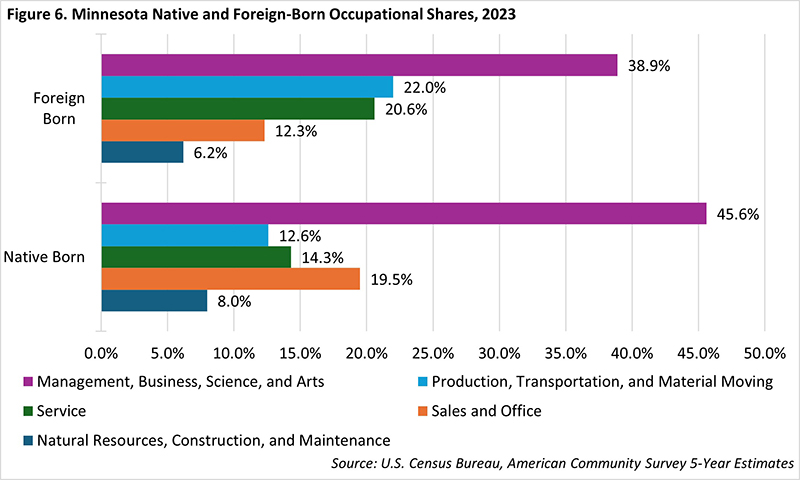
Data from the Census Bureau also allows for the analysis of Minnesota's foreign-born employment by occupation. At the broadest level, ACS data shows foreign-born workers to have a much higher share of employment in Production, Transportation, & Material Moving occupations (22.0%) than native-born workers (12.6%). Foreign-born workers also have a higher share of employment in Service occupations (20.6%) than native-born workers (14.3%). This broad occupational group includes Healthcare Support, Protective Service, Food Preparation & Serving, Building & Grounds Cleaning & Maintenance and Personal Care & Service occupations. Meanwhile, ACS data shows foreign-born workers to have lower shares of workers in the following occupational groups: Management, Business, Science, & Arts; Sales & Office; and Natural Resources, Construction & Maintenance (see Figure 6).

According to 2023 ACS 1-year estimates extracted from the Integrated Public Use Microdata Series or IPUMS, Minnesota had approximately 366,300 foreign-born workers making up over one-ninth (11.6%) of the state's total workforce, showing a continued increase. Nursing, Psychiatric & Home Health Aides had the most foreign-born workers of any occupation, with over 17,100 such workers in 2023. Other occupations with over 10,000 foreign-born workers included Registered Nurses, Managers and Other Production Workers. Minnesota's foreign-born workers were also significantly employed as Software Developers, Assemblers & Fabricators, Truck Drivers, Janitors & Building Cleaners, Chefs & Cooks and more (see Table 2).
Where foreign-born workers made up 11.6% of Minnesota's total employment in 2023, such workers made up significantly higher shares of employment in specific occupations. For example, foreign-born workers accounted for three-quarters (75.0%) of the state's Taxi Drivers & Chauffeurs and nearly three quarters (72.3%) of the state's Postal Service Mail Sorters, Processors & Processing Machine Operators. Foreign-born workers also accounted for over half of the state's total employment in the following occupations: Dancers & Choreographers (64.6%); Roofers (55.1%); Carpet, Floor & Tile Installers & Finishers (52.6%); Laundry & Dry-Cleaning Workers (52.1%); Cutting Workers (51.3%); and Chemists & Materials Scientists (50.1%). There were over 50 specific occupations, accounting for over 100,000 foreign-born workers, where such workers accounted for between one-fifth and one-half of each occupation's respective total employment. These occupations varied from Packers & Packagers, Dentists and Software Developers, to Security Guards, Physicians and Childcare Workers.
These occupations span the breadth of typical education requirements, but roles more-often filled by foreign-born workers tend to occupy the extremes of the educational requirement spectrum. Foreign-born workers are both more likely to fill occupations that have low educational requirements like Drivers and Janitors/Building Cleaners as they are occupations with high educational requirements such as Chemists & Materials Scientists, Computer Scientists and Physicians. These trends reflect the bifurcated nature of educational attainment among foreign-born workers in Minnesota, who are both more likely than the native-born population to have less than high a high school degree and more likely to have attained a graduate or professional degree.
| Table 2. Minnesota Top-Employing Occupations with Foreign-Born Workers, 2023 | ||||
| Occupational Title | Number of Foreign-Born Workers | Foreign-Born Share of Total Employment | Total, All Employment | |
| 2023 Job Vacancies | 2022-2032 Employment Outlook | |||
| Total, All Occupations | 366,311 | 11.6% | 139,059 | 1,676,292 |
| Nursing, Psychiatric, & Home Health Aides | 17,154 | 30.3% | 3,374 | 131,628* |
| Registered Nurses | 12,028 | 13.8% | 4,382 | 26,773 |
| Managers | 11,989 | 10.1% | 3,698 | 91,084 |
| Other Production Workers Including Semiconductor Processors & Cooling & Freezing Equipment Operators | 11,307 | 31.9% | 374 | 22,042 |
| Software Developers, Applications & Systems Software | 11,278 | 25.9% | 1,015 | 16,753 |
| Assemblers & Fabricators | 9,971 | 25.4% | 647 | 20,662 |
| Driver/Sales Workers & Truck Drivers | 9,057 | 14.0% | 4,393 | 38,965 |
| Janitors & Building Cleaners | 6,763 | 15.5% | 1,573 | 34,482 |
| Chefs and Cooks | 6,644 | 16.4% | 3,469 | 36,647 |
| Computer Scientists & Systems Analysts/Network Systems Analysts/Web Developers | 6,598 | 15.4% | 564 | 6,514 |
| Laborers and Freight, Stock, & Material Movers, Hand | 6,351 | 12.9% | 939 | 30,841 |
| Personal Care Aides | 5,509 | 15.1% | 5,669 | 131,628* |
| Customer Service Representatives | 5,434 | 9.4% | 1,664 | 35,082 |
| Taxi Drivers & Chauffeurs | 5,194 | 75.0% | 161 | 5,795 |
| Elementary & Middle School Teachers | 5,087 | 9.0% | 653 | 13,128 |
| Social Workers | 5,047 | 15.2% | 1,044 | 8,187 |
| Childcare Workers | 4,789 | 19.6% | 620 | 12,502 |
| Teacher Assistants | 4,756 | 11.6% | 1,922 | 21,353 |
| Cashiers | 4,670 | 9.4% | 3,334 | 53,901 |
| First-Line Supervisors of Sales Workers | 4,396 | 6.7% | 3,075 | 9,935 |
| Source: IPUMS USA, DEED Job Vacancy Survey, DEED Employment Outlook
*Includes data for Home Health & Personal Care Aides, Nursing Assistants, and Psychiatric Aides |
||||
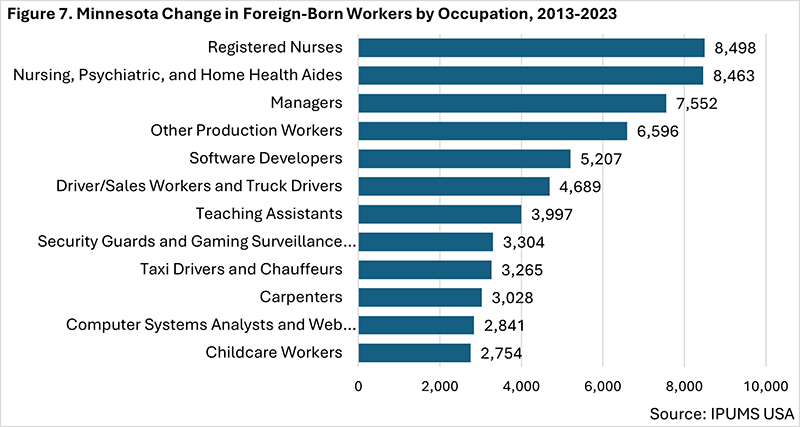
The 1-year estimates from ACS also reveal significant and rapid growth of foreign-born workers in Minnesota. Between 2013 and 2023, there were over 78,400 additional foreign-born workers in the state. This growth rate of 27.2% far outpaced the growth rate for total employment during this period, at 5.2%. Leading this growth, both Registered Nurses and Nursing, Psychiatric & Home Health Aides had an additional 8,500 foreign-born workers between 2013 and 2023. Manager positions across the state experienced an additional 7,500 foreign-born workers, Other Production positions forged an additional 6,600 foreign-born workers, and Software Developers welcomed an additional 5,200 foreign-born workers (see Figure 7).
All in all, nearly 40 specific occupations added at least 1,000 more foreign-born workers between 2013 and 2023. In terms of growth rates, the following occupations witnessed the most rapid increases in foreign-born workers between 2013 and 2023: Electrical Power Line Installers & Repairers; Chemists & Materials Scientists; Security Guards; Claims Adjusters, Appraisers, Examiners & Investigators; Special Education Teachers; Postal Service Mail Carriers; Construction Managers; Farmers, Ranchers & Other Agricultural Managers; Property, Real Estate & Community Association Managers; and Painting Workers & Dyers. In some of these occupations, the number of foreign-born workers increased by 1,000 to 2,000 percent between 2013 and 2023, though overall numbers of people employed were still relatively small.
Recent growth in the number of foreign-born workers across Minnesota's industries and occupations has proven to be critical, as the state is still experiencing tight labor market conditions. Future growth will be essential as DEED's employment projections reveal the need to not only fill newly created jobs, but also to fill a much larger number of existing jobs that become available due to retirements and career changes.

Another vital segment of the workforce is those that are self-employed. The 2021 U.S. Census Bureau's Nonemployer Statistics show a clear difference between Minnesota and national patterns of foreign-born business owners without employees. While the 66,000 foreign-born individuals operating Minnesota businesses without employees (13.9% of total nonemployers) is proportionally higher than their share of the total workforce, this percentage falls significantly below the national average of 24.0%. From 2018 to 2021, an estimated 12,000 additional foreign-born nonemployer establishments opened in Minnesota, accounting for the entire number of nonemployers added in the state over that three-year period4.
In terms of foreign-born nonemployer ownership, the data shows that Minnesota lags U.S. averages in every sector except Transportation and Warehousing, where Minnesota's 44% surpassed the national rate of 43.1%. The largest gaps between Minnesota and U.S. rates appear in Construction (MN: 11.0% vs US: 28.2%), Wholesale Trade (MN: 9.1% vs US: 26.0%), and Administrative Services (MN: 12.7% vs US: 28.4%).
Despite foreign-born workers being more likely than native-born Minnesotan workers to be self-employed, these differences suggest significantly lower participation of foreign-born entrepreneurs in Minnesota's nonemployer businesses compared to national patterns. Transportation & Warehousing is a notable exception, where foreign-born independent contractors and gig workers maintain a strong presence, likely in ride-share and delivery services.
Summary
Minnesota residents born outside of the United States arrive from all corners of the globe to live and work in Minnesota. Once here, foreign-born residents provide healthcare and childcare, produce needed goods, provide vital services, start their own companies and contribute in many other ways. Certain sectors such as Manufacturing and Transportation, and occupations like Nursing Assistants, Drivers, Software Developers and Production Workers rely more upon foreign-born workers. In a tight labor market, foreign-born workers account for almost 11% of Minnesota's labor force and there are 50 diverse occupations where at least one out of every five workers are foreign-born. Immigrants remain an integral and growing part of Minnesota's population and workforce.
Additional Resources
- Minnesota State Demographic Center:
- Minnesota Department of Employment and Economic Development: The Importance of Immigration
- Includes statewide and regional reports
- Minnesota Chamber of Commerce:
- The Brookings Institution: Which US states and occupations are most in need of foreign-born labor?
- U.S. Bureau of Labor Statistics: Foreign-Born Workers Labor Force Characteristics, 2023
- U.S. Census Bureau: Foreign-Born Workforce Visualization
- Center for Migration Studies: Estimates of Undocumented and Eligible-to-Naturalize Population by State
- Burning Glass Institute: From Tech to Traditions: The Influence of Foreign-born workers on U.S. Jobs
1Includes anyone who was not a U.S. citizen at birth, including those who become U.S. citizens through naturalization.
22019-2023 ACS 5-Year Estimates
3ACS 1-year Estimates, Table S0501
4US Census Annual Business Survey Nonemployer Demographic Table 2018 and 2021

