A Surge in Self-Employment

by Cameron Macht
March 2025
Every day in every corner of Minnesota, self-employed business owners go to work contributing to the vitality of our state's economy. They include the professionals preparing taxes or creating advertising campaigns for local businesses, the independent truck drivers keeping products moving through supply chains, the skilled tradespeople building and finishing homes and the real estate agents selling them. These solo entrepreneurs represent a small part of the state's total workforce, but they are important to Minnesota's long-term economic health and resilience.
According to the latest Nonemployer Statistics from the U.S. Census Bureau released in December 2024, Minnesota was home to nearly 445,000 of these businesses, generating just over $25 billion in annual sales receipts in 2022. These enterprises—typically sole proprietorships or partnerships without paid employees—span a wide range of industries, including professional services, transportation, construction, real estate and personal services.
From the wide-open prairies and farmland of Southern Minnesota to the lakeshores in Northern Minnesota and throughout the bustling Twin Cities, these self-employed workers bring flexibility, innovation and adaptability to the state economy. Over the past decade, but especially following the pandemic, the number of self-employed Minnesotans has surged, reflecting a broader cultural and economic shift toward independent work.
While Minnesota is perhaps more well known for our high concentration of Fortune 500 companies per capita, these small businesses and their impact on local economies is undeniable. Since 2006, the number of nonemployer establishments in Minnesota has shot up 17.4%, reaching an impressive 442,345 businesses in 2022. Whether it's side hustles, full-time gigs or pandemic-era pivots turning into permanent careers, this surge highlights a growing appetite for self-employment and small business creation. In comparison, covered employment increased 6.7% in the state from 2006 to 2022, meaning self-employment grew over two and a half times as fast over the same period. And while employer-based employment dropped 6.7% from 2019 to 2020 due to the pandemic recession, self-employment fell just 2.1%, before taking off in 2021 and reaching new peaks in 2022 (Figure 1).

Not So Risky Business
In order to be considered as a nonemployer establishment, the business must have no paid employees, have annual business receipts of $1,000 or more and be subject to federal income taxes. This broad definition encompasses a diverse spectrum of self-employment activities, ranging from full-time entrepreneurs who rely on their business as their primary source of income to part-time business owners who treat it as a supplementary income stream alongside a traditional job or other revenue sources.
According to a 2018 U.S. Small Business Administration report, "nonemployer businesses are the primary source of income for 40% of their owners and an additional source for the remaining 60%. Only about 50% of nonemployer business owners spend less than 20 hours a week working for or managing their business, while 30% spend at least 40 hours a week on the business and about 20% spend between 20 and 40 hours," reflecting a serious investment in their ventures even if it hasn't yet become a full-time endeavor.
For many, starting a business while holding down a full-time job is a strategic move – a way to test the waters without the immediate financial risk of leaving their employer. Some may dream of building something bigger, using their off-hours to nurture a business they hope will one day replace their existing employment. This trend highlights the entrepreneurial spirit of many individuals – motivated by the potential for independence, creative fulfillment or financial growth – who take their first steps into business ownership while still firmly rooted in the traditional workforce.
The uncertainty of the Pandemic Recession not only disrupted the employer-based job market but also fueled a surge of entrepreneurship, as many people began rethinking their careers and priorities. Job losses, furloughs and remote work created both necessity and opportunity, prompting a growing number of individuals to strike out on their own. Some saw gaps in the market and launched businesses to meet new demands, while others used the unexpected downtime to pursue long-held ambitions. With flexible work arrangements becoming more normalized, many took the leap into self-employment, hoping to gain more control over their time and income. By necessity or choice, the pandemic served as a catalyst for a new wave of independent ventures, reshaping the landscape of work and redefining what it means to build a career.
Industry Specialties
Of the 442,500 nonemployer establishments in the state, the largest number of self-employed workers are found in the Professional, Scientific & Technical Services industry with more than 64,000 firms, most notably in Management, Scientific & Technical Consulting; Computer Systems Design Services; Accounting, Tax Preparation, Bookkeeping & Payroll Services; Specialized Design Services; Photographic Services; Legal Services; Advertising, Public Relations & Related Services; Architectural, Engineering & Related Services; and Translation & Interpretation Services. While some of these businesses shut down during the pandemic, they have grown more than 22% from 2006 to 2022, a gain of nearly 11,600 new self-employed businesses.
With just over 61,500 nonemployer businesses, Transportation & Warehousing is the second largest and fastest growing category in the state. Unlike most industries that were negatively impacted by the pandemic in 2020, more than 8,000 new businesses took off in Transportation & Warehousing from 2019 to 2020, and the industry has more than tripled in size since 2006 with the proliferation of ride-sharing and e-commerce delivery services like Uber, Lyft, and DoorDash. Case in point: the number of self-employed Couriers & Messengers jumped to 24,576 in 2022, up more than 500% from 2006; while Taxi and Limousine Services increased 760% from 2006 to 2022, up to 14,448 drivers.
There are more than 47,500 self-employed people in Real Estate, Rental & Leasing, including just under 25,000 people who are Lessors of Real Estate and another nearly 12,000 Offices of Real Estate Agents and Brokers. The state has added almost 7,000 additional nonemployer establishments in this industry from 2006 to 2022, a 16.7% rise. The increase in short-term rental properties, such as those listed on Airbnb and Vrbo, has greatly expanded this segment.
In contrast, the state has seen a decline of just over 7,000 self-employed Construction workers since 2006, despite a resurgence in Construction spending and activity following the pandemic as low interest rates and a shift toward remote work prompted many people to start renovation or new homebuilding projects. From 2019 to 2022, about 800 new Construction nonemployers were added in Minnesota, a 2.0% increase. At the same time, covered employment in the Construction industry shot up by almost 9,000 jobs post-pandemic, a 6.6% increase, furthering the shift away from self-employment to covered employment in Construction.
Just under 38,000 people ran their own nonemployer establishments in Other Services, most notably more than 11,000 Hair, Nail & Skin Care Services, just over 4,600 Automotive Repair & Maintenance shops, and about 3,400 Religious, Grantmaking, Civic & Professional Services. As many of these are personal services, the pandemic definitely led to a loss of these businesses, though that was an extension of declines experienced since 2006. In fact, Other Services declined by 20% from 2006 to 2022, the largest and fastest decline of any industry over time (Table 1).
| Table 1. Minnesota Nonemployer Statistics by Industry, 2022 | ||||||
|---|---|---|---|---|---|---|
| Industry Sector | 2022 Annual Data | Change in Nonemployer Establishments | ||||
| 2006-2022 | 2019-2020 | |||||
| Number of Nonemployer Establishments | Sales Receipts ($1,000s) | Number | Percent | Number | Percent | |
| Total for All Sectors | 442,345 | $25,184,331,000 | +65,481 | +17.4% | -8,649 | -2.1% |
| Professional, Scientific & Technical Svcs. | 64,180 | $2,945,120,000 | +11,599 | +22.1% | -3,308 | -5.2% |
| Transportation & Warehousing | 61,513 | $3,605,181,000 | +43,522 | +241.9% | +8,042 | +17.9% |
| Real Estate & Rental & Leasing | 47,516 | $5,432,076,000 | +6,788 | +16.7% | +120 | +0.3% |
| Construction | 40,887 | $3,601,577,000 | -7,144 | -14.9% | +566 | +1.4% |
| Other Services | 37,817 | $1,445,069,000 | -9,685 | -20.4% | -545 | -1.5% |
| Retail Trade | 35,981 | $1,799,910,000 | -3,354 | -8.5% | +813 | +2.1% |
| Arts, Entertainment & Recreation | 34,381 | $779,758,000 | +12,551 | +57.5% | -7,062 | -21.6% |
| Admin. Support & Waste Mgmt. Svcs. | 30,425 | $879,844,000 | +8,105 | +36.3% | -1,425 | -4.8% |
| Health Care & Social Assistance | 29,670 | $1,156,143,000 | -3,586 | -10.8% | -1,028 | -3.6% |
| Educational Services | 15,143 | $217,569,000 | +5,524 | +57.4% | -3,052 | -18.8% |
| Finance & Insurance | 12,220 | $1,438,402,000 | -2,200 | -15.3% | -421 | -3.4% |
| Manufacturing | 7,514 | $380,759,000 | +347 | +4.8% | -218 | -3.1% |
| Wholesale Trade | 6,593 | $675,527,000 | -463 | -6.6% | -313 | -5.2% |
| Accommodation & Food Services | 6,529 | $279,290,000 | +2,732 | +72.0% | -148 | -2.8% |
| Information | 5,893 | $213,765,000 | +8 | +0.1% | -622 | -11.3% |
| Agriculture, Forestry, Fishing & Hunting | 5,641 | $295,191,000 | +769 | +15.8% | -67 | -1.2% |
| Utilities | 271 | $26,183,000 | -40 | -12.9% | +17 | +7.7% |
| Mining, Quarrying & Oil & Gas Extraction | 171 | $12,967,000 | +8 | +4.9% | +2 | +1.2% |
| Source: U.S. Census Bureau, Nonemployer Statistics | ||||||
Retail Trade has nearly 36,000 self-employed businesses in Minnesota, despite losing over 3,350 of these small-scale sellers since 2006. This includes over 4,000 Clothing & Accessories Retailers, about 3,400 Cosmetics & Beauty Suppliers, 2,705 Food & Beverage Retailers, 2,400 Used Merchandise Retailers and about 1,600 Used Car Dealers.
With 57.5% growth in self-employed artists, musicians and event organizers since 2006, despite a big drop during the pandemic, it's clear that Minnesota's creative economy is thriving with more than 34,350 nonemployers in Arts, Entertainment & Recreation. This includes almost 21,200 Independent Artists, Writers & Performers, following a 45% surge since 2006, a gain of more than 6,600 people.
With 30,425 nonemployer establishments, Administrative Support & Waste Management Services is the next largest industry. Of those, there are nearly 18,500 people who provide self-employed Services to Buildings & Dwellings, most notably Janitorial Services & Landscaping Services. Despite a 5% decline during the pandemic, the industry has low barriers to entry and has seen a huge 36% increase from 2006 to 2022, marking the fourth largest increase over time.
Health Care & Social Assistance has cut nonemployers by almost 3,600 from 2006 to 2022, dropping more than 10%, primarily due to a drop of more than 10,000 self-employed operations in Child Care Services. In 2006, there were 20,434 in-home daycare providers in the state; by 2022, there were 10,374, essentially cut in half. This has led to a quiet crisis in child care availability, especially in Greater Minnesota. In contrast, the number of Mental Health Practitioners nearly tripled, rising from 1,300 in 2006 to 3,610 in 2022. Home Health Care Services also saw a sizeable increase of nearly 1,000 additional nonemployer establishments from 2006 to 2022 responding to the state's aging population.
Regional Specialties
Breaking down self-employment by region, nearly 60% of the nonemployer establishments in the state were located in the seven-county Twin Cities metro area. The next largest number were in Central and Northwest Minnesota, which both accounted for over 10% of the state total. Southeast and Southwest had about 8% and 6%, respectively, while Northeast had the smallest amount with less than 5% of the nonemployers in the state.
While the total in Minnesota increased 17.4% from 2006 to 2022, growth patterns were very different across the state. As the state's primary population and economic center, the Twin Cities accounted for 88% of the gain in nonemployers during that time frame, following a 28% increase, equivalent to nearly 58,000 additional businesses. Southeast, Central and Northwest also saw steady long-term growth ranging from 4% to 8%, while Southwest increased less than 2% and Northeast actually saw a small decline in nonemployers since 2006.
Not surprisingly, all six regions lost nonemployers during the pandemic, with Northeast dropping the most from 2019 to 2020. This is related to a higher concentration of self-employment in Accommodation & Food Services, Arts, Entertainment & Recreation, Other Services and Retail Trade. However, Northeast then saw the fastest increase from 2020 to 2022, expanding almost 10% as new people struck out on their own following the pandemic. Again, the Twin Cities accounted for the majority of the nonemployer growth in the state, but Greater Minnesota had a bigger influence in the post- pandemic recovery, comprising about 35% of the net change (see Table 2).
| Table 2. Minnesota Nonemployer Statistics by Region, 2022 | ||||||||
|---|---|---|---|---|---|---|---|---|
| Area | Number
of Nonemployers |
Percent
of State Total |
Change from
2006-2022 |
Change from
2019-2020 |
Change from
2020-2022 |
|||
| Number | Percent | Number | Percent | Number | Percent | |||
| Central | 52,800 | 11.9% | +3,227 | +6.5% | -166 | -0.3% | +3,339 | +6.8% |
| Northeast | 21,331 | 4.8% | -288 | -1.3% | -981 | -4.8% | +1,871 | +9.6% |
| Northwest | 44,632 | 10.1% | +1,775 | +4.1% | -754 | -1.8% | +2,323 | +5.5% |
| Southeast | 34,378 | 7.8% | +2,566 | +8.1% | -881 | -2.7% | +2,507 | +7.9% |
| Southwest | 27,704 | 6.3% | +450 | +1.7% | -721 | -2.7% | +1,507 | +5.8% |
| Twin Cities | 261,500 | 59.1% | +57,751 | +28.3% | -5,146 | -2.1% | +21,367 | +8.9% |
| Minnesota | 442,345 | 100.0% | +65,481 | +17.4% | -8,649 | -2.1% | +32,914 | +8.0% |
| Source: U.S. Census Bureau, Nonemployer Statistics | ||||||||
Of the 87 counties in the state, 40 of them have seen a long-term decline in nonemployers. Instead, from 2006 to 2022, the largest and fastest growth occurred in metropolitan counties, especially the Twin Cities, but also Clay (Moorhead), Olmsted (Rochester), Stearns (St. Cloud), and Blue Earth County (Mankato). Table 3 includes a list of the 15 fastest growing counties since 2006 – strangely, only 12 counties showed faster growth rates than the state as a whole (17.4%), but because of their size, their growth overwhelmed the change in the other 75 counties, including the 40 counties that lost nonemployers.
| Table 3. Top 15 Counties by Growth in Nonemployers in Minnesota, 2022 | ||||||||
|---|---|---|---|---|---|---|---|---|
| Area | Number
of Nonemployers |
Percent
of State Total |
Change from
2006-2022 |
Change from
2019-2020 |
Change from
2020-2022 |
|||
| Number | Percent | Number | Percent | Number | Percent | |||
| Carver Co. | 9,135 | 2.1% | +2,229 | +32.3% | -80 | -0.9% | +600 | +7.0% |
| Clay Co. | 4,513 | 1.0% | +1,041 | +30.0% | -137 | -3.2% | +382 | +9.2% |
| Washington Co. | 21,351 | 4.8% | +4,920 | +29.9% | +97 | +0.5% | +1,703 | +8.7% |
| Hennepin Co. | 115,535 | 26.1% | +26,261 | +29.4% | -3,637 | -3.3% | +8,963 | +8.4% |
| Scott Co. | 12,512 | 2.8% | +2,842 | +29.4% | -5 | 0.0% | +911 | +7.9% |
| Ramsey Co. | 41,919 | 9.5% | +9,379 | +28.8% | -1,980 | -5.0% | +3,915 | +10.3% |
| Olmsted Co. | 11,063 | 2.5% | +2,425 | +28.1% | -359 | -3.4% | +952 | +9.4% |
| Anoka Co. | 26,985 | 6.1% | +5,371 | +24.8% | +117 | +0.5% | +2,481 | +10.1% |
| Dakota Co. | 34,063 | 7.7% | +6,749 | +24.7% | +342 | +1.1% | +2,794 | +8.9% |
| Stearns Co. | 11,884 | 2.7% | +1,947 | +19.6% | -40 | -0.4% | +799 | +7.2% |
| Blue Earth Co. | 4,452 | 1.0% | +713 | +19.1% | -114 | -2.7% | +329 | +8.0% |
| Wright Co. | 11,113 | 2.5% | +1,709 | +18.2% | +179 | +1.8% | +889 | +8.7% |
| Rice Co. | 4,632 | 1.0% | +561 | +13.8% | -36 | -0.8% | +397 | +9.4% |
| Rock Co. | 819 | 0.2% | +99 | +13.8% | +16 | +2.1% | +45 | +5.8% |
| Otter Tail Co. | 5,099 | 1.2% | +517 | +11.3% | -87 | -1.8% | +271 | +5.6% |
| Source: U.S. Census Bureau, Nonemployer Statistics | ||||||||
Despite the Pandemic Recession, 11 counties added nonemployers from 2019 to 2020, two held steady, while the other 74 lost self-employed workers in the face of unprecedented economic change. Since then, just three counties – Koochiching, Kittson and Wilkin – have not added new nonemployers during the recovery. The other 84 counties have all seen a net gain in nonemployers since 2020, with widespread increases, including 27 counties that grew faster than the state as a whole (8.0%) and 50 counties that grew 5.0% or more.
With more than 115,000 self-employed businesses, Hennepin County had more than one-quarter of all the nonemployers in the state. Other Twin Cities metro counties Ramsey, Dakota, Anoka and Washington round out the top 5 largest counties. On the other end of the spectrum, the counties with the smallest number of nonemployers are all in Northwest Minnesota: Lake of the Woods, Mahnomen, Kittson, Traverse and Red Lake County each had fewer than 400 self-employed businesses in 2022.
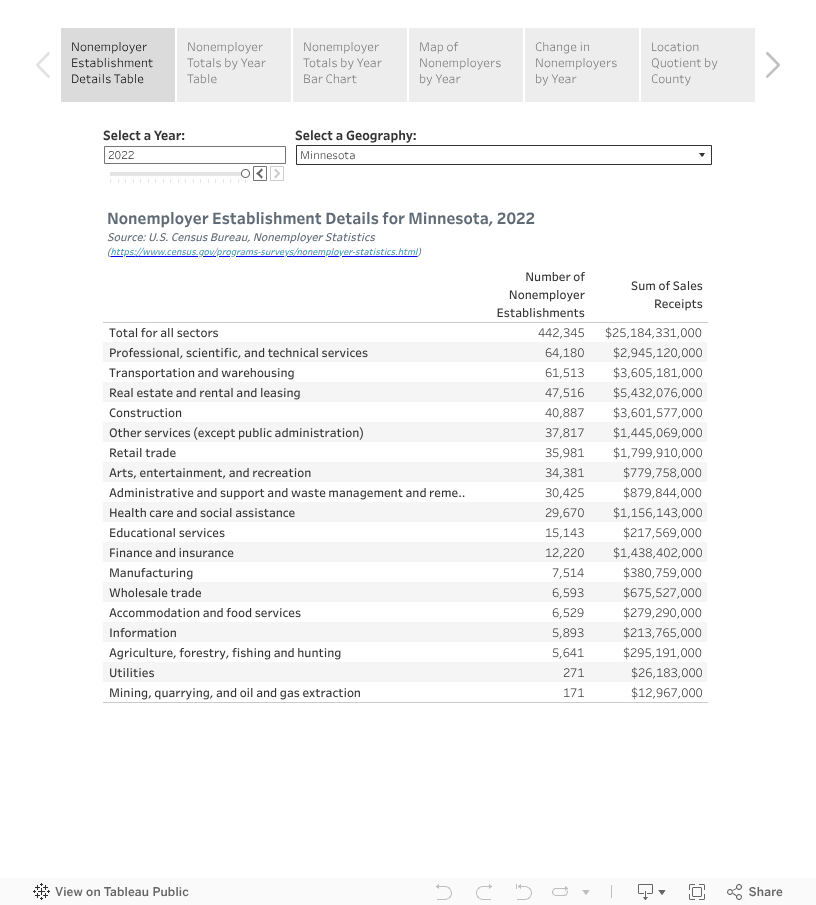
For additional detail at the county level, this article includes an interactive Tableau visualization that features detailed tables with the number of nonemployers and sales receipts by industry for every county as well as maps and charts showing the changes from 2006 to 2022. The filters allow users to select the geography, industry and years of interest.
To provide useful context, the visualization also includes a map of Location Quotients by county. Location Quotients are a measurement of an industry's employment concentration in a county relative to that industry's concentration in the state of Minnesota. A location quotient is calculated by dividing the employment of a selected industry in a county by that county's total employment for all industries. That local result is then divided by the same calculation performed at the state level. A location quotient of 1.0 means that the county's employment concentration is equal to its concentration in the state, while anything greater than 1.0 means that there is a higher employment concentration or less than 1.0 indicates a lower employment concentration for that industry in the county. For example, Map 1 shows the counties with the highest concentration of nonemployers in Construction, with Mille Lacs, Kanabec and Fillmore County all having location quotients above 2.0 in 2022.

Likewise, another tab provides a bar chart showing the change in nonemployers by industry over time. The filters on the chart can be modified to show just selected years or specific industries, showing one county at a time. Figure 2 shows the change in nonemployers in Anoka County since 2006.

Though this is a good start, the data in the visualization and on the Census Bureau's website provides for additional analysis. For example, a separate but related dataset contains demographic characteristics of these Nonemployers. The Nonemployer Statistics by Demographics (NES-D) tables are updated through 2021, and provide owner characteristics such as gender, race, ethnicity, veteran status and age.
Summarizing the Surge
Minnesota has seen a significant rise in self-employment, with nearly 445,000 nonemployer businesses generating over $25 billion in annual sales receipts in 2022. This represents a 17.4% increase since 2006, a rate over two and a half times faster than the 6.7% growth in traditional employment. The surge reflects a broader shift toward independent work, accelerated by the pandemic as people sought greater flexibility and autonomy. These self-employed individuals, ranging from tax preparers and real estate agents to truck drivers and construction workers, contribute to the state's economic resilience. The pandemic particularly highlighted the stability of self-employment, as nonemployer businesses experienced a smaller decline (-2.1%) compared to employer-based jobs (-6.7%) and rebounded quickly in 2021 and 2022.
Industries with the highest numbers of self-employed workers include Professional, Scientific & Technical Services, Transportation & Warehousing and Real Estate, with some sectors, such as e-commerce-related delivery services, seeing explosive growth. Geographically, self-employment is concentrated in the Twin Cities, which accounts for nearly 60% of nonemployer businesses, though growth has been evident across the state, particularly in regions like Central and Northwest Minnesota. While some industries, such as construction and child care services, have seen declines in self-employment, others, including mental health services and short-term real estate rentals, have expanded. This trend underscores the evolving nature of work in Minnesota, with self-employment playing an increasingly vital role in the state's economy.
Interactive Tableau Visualization - Nonemployer Establishments in Minnesota