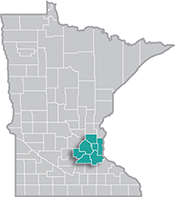
 The Minneapolis-St. Paul metropolitan area is a national leader in finance, advanced manufacturing, agriculture and retailing.
Medical devices, electronics and processed foods are strong suits recognized globally.
Want the freshest data delivered by email? Subscribe to our regional newsletters.
DEED’s Labor Market Information Office outlines how green and clean employment is defined and distributed across Metro Area industries, highlighting employment shares, wages and county-level estimates within Minnesota’s emerging clean economy.
8/24/2026 4:10:50 PM
Tim O'Neill
The /deed/index.jspDepartment of Employment and Economic Development's (DEED) /deed/data/index.jspLabor Market Information Office recently began the effort of defining and analyzing green and clean employment in the State of Minnesota. Check out these quarterly /deed/newscenter/publications/trends/index.jspEconomic Trends articles to get a comprehensive look at how this has been done:
Let's dig into the potential green and clean economy in the Metro Area.
The Bureau of Labor Statistics (BLS) defines green jobs as either:
In /deed/newscenter/publications/trends/june-2024/green.jspA Starting Point, we can see the conservative estimate of green jobs in each of the major industry sectors. Some of these sectors had higher shares of green jobs, including Transportation; Construction; Utilities; Agriculture, Forestry, Hunting & Fishing; Professional, Scientific, & Technical Services; Manufacturing; and Waste Management & Administrative Services. Table 1 highlights the Metro Area's employment in these industries, including a finer look at those in-depth sectors in Utilities.
Overall, the Metro Area accounts for about three-fifths (60.2%) of Minnesota's total employment. In those sectors with higher shares of green employment, the Metro Area accounts for anywhere from 15.9% of the state's total employment in Agriculture, Forestry, Fishing & Hunting to 76.1% of the state's total employment in Natural Gas Distribution. By county, estimated clean-economy employment in the Metro Area was the following in 2024:
Estimated higher shares of clean-economy employment in counties like Anoka and Scott County are likely due to the higher shares of select industry employment in industries like Manufacturing in Anoka County and Construction and Transportation & Warehousing in Scott County. It should be noted that many of these industries have significantly higher average annual wages.
| Industry | Number of Jobs | Metro Share of MN Total Employment | Number of Firms | 2022 MN Green Employment Share | Avg. Annual Wage |
|---|---|---|---|---|---|
| Total, All Industries | 1,773,308 | 60.2% | 93,587 | 3.1% | $83,668 |
| Manufacturing | 169,839 | 53.9% | 3,898 | 6.0% | $97,188 |
| Professional, Scientific, and Technical Services | 122,317 | 73.6% | 12,007 | 6.8% | $130,208 |
| Construction | 83,043 | 55.8% | 7,136 | 11.4% | $101,296 |
| Administrative and Support and Waste Management and Remediation Services | 82,666 | 67.9% | 4,694 | 5.0% | $56,888 |
| Transportation and Warehousing | 79,368 | 68.3% | 2,109 | 13.3% | $76,700 |
| Utilities | 7,142 | 48.1% | 127 | 7.8% | $143,728 |
| Electric Power Generation, Transmission and Distribution | 5,382 | 43.0% | 88 | - | $155,324 |
| Natural Gas Distribution | 1,061 | 76.1% | 21 | - | $120,900 |
| Water, Sewage and Other Systems | 699 | 75.1% | 18 | - | $88,712 |
| Agriculture, Forestry, Fishing and Hunting | 3,804 | 15.9% | 291 | 7.4% | $45,500 |
| Source: DEED Quarterly Census of Employment and Wages | |||||
To discover more about labor market conditions in the Metro Area, contact Tim O'Neill, Labor Market Analyst, at timothy.oneill@state.mn.us

