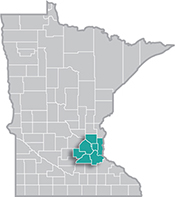
 The Minneapolis-St. Paul metropolitan area is a national leader in finance, advanced manufacturing, agriculture and retailing.
Medical devices, electronics and processed foods are strong suits recognized globally.
Want the freshest data delivered by email? Subscribe to our regional newsletters.
IT and Math Experts were ranked second among all occupational groups in being considerably harder for job-seeking clients to get hired compared to one year prior.
6/16/2026 4:10:50 PM
Tim O'Neill
In 2025, there were around 80,000 people employed in computer-related occupations in the seven county Twin Cities Metro area, accounting for just over 4.5% of total employment in the region. And while the Twin Cities has about 60% of total employment in the state, it is home to nearly 75% of the state's Information Technology workers.
These occupations tend to offer /deed/data/data-tools/oes/index.jsphigh wages and are in /deed/data/data-tools/oid/index.jsphigh demand, and typically are highlighted as among the /deed/data/data-tools/employment-outlook/index.jspfastest growing in the region. While the median wage across all occupations in the region was $28.48 per hour, median wages for computer-related occupations ranged from a low of almost $32 for Computer User Support Specialists to nearly $85 an hour for Computer & Information Systems Managers (see Table 1).
| SOC Code | SOC Occupational Title | Estimated Regional Employment | Median Hourly Wage |
|---|---|---|---|
| 000000 | Total, All Occupations | 1,762,280 | $28.48 |
| 113021 | Computer & Information Systems Managers | 8,510 | $84.56 |
| 150000 | Computer & Mathematical Occupations | 71,750 | $51.35 |
| 151211 | Computer Systems Analysts | 8,220 | $53.11 |
| 151212 | Information Security Analysts | 2,060 | $63.22 |
| 151221 | Computer & Information Research Scientists | 50 | $64.26 |
| 151231 | Computer Network Support Specialists | 2,120 | $39.01 |
| 151232 | Computer User Support Specialists | 9,890 | $31.75 |
| 151241 | Computer Network Architects | 1,550 | $61.88 |
| 151242 | Database Administrators | 720 | $49.00 |
| 151243 | Database Architects | 780 | $64.80 |
| 151244 | Network & Computer Systems Administrators | 2,840 | $47.35 |
| 151251 | Computer Programmers | 1,570 | $56.45 |
| 151252 | Software Developers | 29,140 | $63.22 |
| 151253 | Software Quality Assurance Analysts & Testers | 2,390 | $51.89 |
| 151254 | Web Developers | 1,030 | $50.67 |
| 151255 | Web & Digital Interface Designers | 1,050 | $40.20 |
| 151299 | Computer Occupations, All Other | 2,840 | $49.61 |
| 152011 | Actuaries | 740 | $53.24 |
| 152031 | Operations Research Analysts | 1,130 | $45.29 |
| 152041 | Statisticians | 780 | $32.02 |
| 152051 | Data Scientists | 2,840 | $58.52 |
Source: DEED Occupational Employment & Wage Statistics
According to our 2025 Occupations in Demand rankings, the /deed/data/data-tools/oid/index.jsphighest demand in the region was for Computer User Support Specialists, Computer Systems Analysts and Software Developers. Demand for Computer occupations in the Metro Area had jumped in the two years following the pandemic recession but dropped a little in the past year as employers pulled back on hiring. To that end, data from the January 2026 /deed/data/data-tools/job-search-experience/index.jspJob Search Experience Survey showed that IT and Math Experts were ranked second among all occupational groups in being considerably harder for job-seeking clients to get hired compared to one year prior (see Table 2).
| What positions is it CONSIDERABLY HARDER for your job-seeking clients to get hired for now compared to one year ago? | Twin Cities Metro | State of Minnesota |
|---|---|---|
| IT and Math Experts (e.g., Software Engineers, IT Support Specialists, Data Analysts) [SOC-15] | 43% | 35% |
| Managers and Leaders (e.g., Business Executives, School Principals, Construction Managers) [SOC-11] | 40% | 33% |
| Creative Professionals and Media Workers (e.g., Graphic Designers, Writers, Public Relations Specialists, Musicians) [SOC-27] | 40% | 32% |
| Business and Finance Professionals (e.g., Accountants, Financial Advisors, HR Specialists, Project Managers) [SOC-13] | 40% | 31% |
| Office Support Staff (e.g., Receptionists, Administrative Assistants, Accounting Clerks) [SOC-43] | 25% | 24% |
| Educators and Librarians (e.g., Teachers, Professors, Librarians) [SOC-25] | 24% | 23% |
| Scientists and Researchers (e.g., Biologists, Economists, Biological Technicians) [SOC-19] | 28% | 21% |
| Community and Social Service Workers (e.g., Social Workers, Counselors, Clergy Members) [SOC-21] | 20% | 20% |
| Legal Professionals (e.g., Lawyers, Paralegals, Judges) [SOC-23] | 19% | 18% |
| Production and Manufacturing Workers (e.g., Machine Operators, Assembly Line Workers, Power Plant Operators) [SOC-51] | 21% | 18% |
| Architects and Engineers (e.g., Architects, Mechanical Engineers, Engineering Technicians) [SOC-17] | 17% | 16% |
| Sales Professionals (e.g., Retail Salespeople, Real Estate Agents, Sales Representatives) [SOC-41] | 21% | 15% |
| No occupations are considerably harder to get hired for | 14% | 14% |
| Healthcare Specialists (e.g., Doctors, Nurses, Healthcare Technologists, Medical Records Specialists) [SOC-29] | 19% | 13% |
| Construction, Skilled Trade and Extraction Workers (e.g., Electricians, Construction Laborers, Equipment Operators) [SOC-47] | 15% | 12% |
| Healthcare Support Workers (e.g., Nursing Assistants, Personal Care Aides, Medical Assistants) [SOC-31] | 18% | 11% |
| Protective Service Workers (e.g., Police Officers, Firefighters, Security Guards, Lifeguards) [SOC-33] | 10% | 11% |
| Installation and Repair Workers (e.g., Auto Mechanics, HVAC Technicians, Industrial Machinery Mechanics) [SOC-49] | 13% | 11% |
| Drivers and Movers (e.g., Truck Drivers, Delivery Drivers, Warehouse Movers) [SOC-53] | 13% | 10% |
| Personal Care Workers (e.g., Hairstylists, Childcare Workers, Recreation Workers, Funeral Service Workers) [SOC-39] | 11% | 10% |
| Agricultural and Outdoor Workers (e.g., Farm Workers, Food Graders and Sorters, Forestry Workers) [SOC-45] | 10% | 8% |
| Cleaning and Maintenance Workers (e.g., Janitors, Landscapers, Housekeepers) [SOC-37] | 9% | 7% |
| Food Service Workers (e.g., Chefs, Servers, Bartenders) [SOC-35] | 12% | 7% |
Though slower now, demand for Information Technology workers will remain in the region. In our last round of employment projections, computer occupations were forecast to grow nearly 15% over the decade in the Twin Cities, a gain of 13,500 net new jobs. In addition, there are projected to be as many as 20,000 additional openings due to labor market exit openings – jobs that currently exist but become available when the current worker retires or leaves the labor force for some other reason.
For more information about computer-related occupations in the Twin Cities, contact Tim O'Neill at Timothy.ONeill@state.mn.us.

