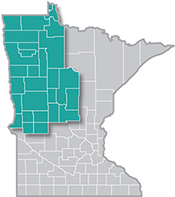
 The presence of such industry powerhouses as Polaris, Arctic Cat and New Flyer make Northwest Minnesota a hub of transportation equipment manufacturing.
From wheat and potatoes to soybeans and sugar beets, the region is a major producer and processor of food staples and specialty agricultural products.
Want the freshest data delivered by email? Subscribe to our regional newsletters.
Paul Bunyan and Babe the Blue Ox statues carry real economic weight in Northwest Minnesota's employment trends in forestry and downstream industries
8/15/2026 1:32:47 PM
Anthony Schaffhauser
How many people have taken a photo with Paul Bunyan and Babe the Blue Ox in Northwest Minnesota? According to Perplexity, an artificial intelligence application, nobody knows. "The statues at Bemidji are widely cited as one of the most-photographed roadside icons, but a precise headcount isn't available." But if you don't have a picture, it's not too late! Paul and Babe are standing tall, in Bemidji, Brainerd and Akeley.
What's more, the employment trends in forestry and downstream industries suggest the tradition still carries real economic weight in Northwest Minnesota.
Yes. It starts with the forest, of course, and the larger industry provides an economic incentive to care for it. Mike Sullivan, Program Director for Minnesota ForestryWorks states, "Green careers are about building a sustainable future, and forestry is one of Minnesota's original green industries. Every day, forestry professionals balance environmental stewardship with economic growth, ensuring our forests remain healthy while supporting thousands of jobs across the state."
The industry trade group says much the same. The tagline of Minnesota Forest Industries is “We take care of the forest, and the "Forest Facts" section of their website features the positive climate impact of trees. There's a straightforward logic to it: harvested wood keeps storing carbon once it becomes a wall stud or a window frame, and a working forest economy is what pays for active management of the resource.
As of 2025's fourth quarter, Northwest Minnesota accounts for 7.6% of total jobs in the state, and 34.3% of Minnesota's Forestry and Logging jobs.
Due to confidentiality restrictions, many quarters of employment data for Forestry and Logging are suppressed in the Northwest to respect the privacy of individual firms operating in a few communities in the most rural areas near forests. So rather than showing a data table riddled with gaps, here are some key facts:
One wrinkle worth naming before we go further: Forestry and Logging in Northwest Minnesota are really two separate things stitched together. Of those 293 jobs in 2025's fourth quarter mentioned above, 179 of them were in Logging and 114 were in Forest Nurseries and Gathering of Forest Products — and only 18 of those jobs were in the private sector.
The rest are public sector, reflecting the Badoura State Forest Nursery in Akeley. Those nursery jobs pay well above the regional average, which lifts the sector's overall wage; private logging pays an average $997 per week, slightly below the all-industry average of $1,132. Also, much of the employment is seasonal, with a frantic "Spring Lift" six-week spring seedling harvest in April and May that requires a staffing surge. I'll provide more about the staffing challenges this facility faces in part two next month.
The Forestry versus Logging distinction matters for what comes next, so I'll use Logging alone where the comparison needs to be apples-to-apples.
High employment concentration in a region signals competitiveness — it suggests firms find real advantages in locating there. We use /deed/data/data-tools/qcew/qcew-location-quotient.jsplocation quotients (LQs) to succinctly denote employment concentration in a region compared to a larger geographic area. Analysts generally treat an LQ above 1.25 as evidence that an industry sells beyond the local market, and an LQ above 2.0 as strong specialization. Northwest Minnesota's Forestry and Logging employment overall is 4.5 times more concentrated than statewide; Logging by itself comes in at 3.4. Put simply, the region is darn good at it.
This doesn't even include self-employment, which is common for this industry. More to come on that in part two as well.
Despite the roadside attraction, please note that the Northwest as a whole is not the proverbial Paul Bunyan of Forestry and Logging in the state. In fact, Northeast Minnesota has a 9.1 LQ (see Figure 1). To state the obvious, Forestry and Logging only happens in forests, and over half of the Northwest is prairie, whereas Northeast has more forest areas. The /deed/data/lmi-help/area-maps/index.jspHeadwaters Region — which is home to two of the three iconic Paul and Babe statues — has a 20.0 LQ. That's an order of magnitude more than what's considered strong.
Figure 1: Forestry and Logging Industry Location Quotients for Economic Development Regions

Source: /deed/data/data-tools/qcew/qcew-location-quotient.jspMinnesota Location Quotient Tool, DEED Labor Market Information Office
The economic impact of forestry is multiplied many times down the supply chain, as harvested wood is manufactured into products that are in turn incorporated into final demand products, mainly in construction. Wood product manufacturing — from mills to engineered wood such as OSB, windows and doors, containers and pallets and more — is all here in Northwest Minnesota. Furniture & Related Products are manufactured in the region as well (see Table 1).
| NAICS | Industry | Year Ending Q1 2020* | Year Ending Q1 2026* | Change | |
|---|---|---|---|---|---|
| Jobs | Percent | ||||
| 321 | Wood Product Manufacturing | 3,374 | 3,199 | -175 | (5.2%) |
| 3211/3212 | Sawmills, Plywood & Engineered Wood^ | 546 | 548 | 2 | 0.3% |
| 3219 | Other Wood Product Manufacturing | 2,827 | 2,651 | -176 | (6.2%) |
| 32191 | Millwork | 2,381 | 2,276 | -105 | (4.4%) |
| 321911 | Wood Window & Door Manufacturing | 2,290 | 2,191 | -99 | (4.3%) |
| 32192 | Wood Container & Pallet Manufacturing | 178 | 167 | -11 | (6.3%) |
| 32199 | All Other Wood Product Manufacturing | 268 | 208 | -60 | (22.4%) |
| 337 | Furniture & Related Product Manufacturing | 641 | 647 | 6 | 0.9% |
* To use the most recent data available while covering a full year, employment figures are averaged across four quarters, Q2 through Q1 of the following year. So year ending Q1 2026 figures span 2025 Q2 through 2026 Q1, compared to the same four quarters ending Q1 2020. Note also that year ending Q1 2020 is unaffected by the COVID-19 shutdown: QCEW counts employment for the pay period including the 12th of each month, so the last observation in that window was March 12, 2020 - four days before Minnesota's March 16 closures.
^ Sawmills & Wood Preservation and Veneer, Plywood & Engineered Wood are shown combined because one establishment was recoded between these two industries in 2026 Q1 through the Annual Refiling Survey. Such non-economic code changes are implemented with first-quarter data and reflect administrative reclassification rather than economic change. Reported separately, the two series are not comparable across this window; combined, they are unaffected.
Source: DEED, Quarterly Census of Employment and Wages
Employment in Wood Products Manufacturing has declined, with the exceptions of Sawmills & Wood Preservation and Veneer, Plywood & Engineered Wood (including OSB), which were flat. Furniture & Related Product Manufacturing employment has also been flat.
But employment change alone doesn't tell the story of the economic impact of these industries. Automation and improved efficiency can sustain — or raise — production with fewer workers, and the wage trend bears this out (Table 2).
| NAICS | Industry | Average Weekly Wage Year Ending Q1 2026* | Change, Year Ending Q1 2020 to Year Ending Q1 2026* | Wage Premium (Percent Above Total All Industries) |
|---|---|---|---|---|
| 0 | Total, All Industries | $1,081 | 33.6% | N/A |
| 321 | Wood Product Manufacturing | $1,476 | 42.0% | 36.5% |
| 3211 | Sawmills & Wood Preservation^ | $1,095 | 98.1% | 1.3% |
| 3212 | Veneer, Plywood, & EngineeredWood | $1,490 | 23.1% | 37.8% |
| 3219 | Other Wood Product Manufacturing | $1,490 | 44.2% | 37.9% |
| 32191 | Millwork | $1,580 | 43.8% | 46.2% |
| 321911 | Wood Window & DoorManufacturing | $1,599 | 43.8% | 47.9% |
| 32192 | Wood Container & Palle tManufacturing | $869 | 31.6% | -19.6% |
| 32199 | All Other Wood Product Manufacturing | $1,003 | 43.8% | -7.2% |
| 337 | Furniture & Related Product Manufacturing | $1,106 | 29.1% | 2.3% |
* Wage figures are averaged across the same four-quarter windows described in Table 1.
^ Sawmill wages in the most recent window reflect an unusually large single-quarter figure that is currently under review. The wage change and premium for this industry should be treated as provisional.
Source: DEED, Quarterly Census of Employment and Wages
Higher wages generally indicate higher value added. Making windows and doors adds more value to wood than making containers and pallets, and the wage premium reflects that. Nearly all of these wood-using manufacturing industries pay above-average wages, with the Wood Product Manufacturing subsector as a whole paying more than 35% above the regional average — rising 42% over six years, well ahead of the region's average 33.6% wage growth.
In dollar terms: Wood Product Manufacturing generated roughly $245 million in payroll in the 2026's first quarter, with another $37 million from Furniture & Related Products. That's about $283 million flowing into Northwest Minnesota households from these industries alone.
Higher value added isn't the only reason Wood Products Manufacturing is such an economic boon to the region. These products are sold outside the region, and that makes them a different kind of economic contributor. The term used by the Harvard cluster researchers is "traded industries," as opposed to local-serving industries that sell only within the region. Traded industries bring in outside money, adding to the region's economic base, and those dollars are multiplied as they're re-spent supporting local-serving businesses.
Location Quotients tell the same story. Wood Product Manufacturing has a 3.2 LQ (see Table 3). At more than three times the statewide employment concentration, Northwest Minnesota's Wood Products plants are plainly producing far more than the region itself consumes.
| NAICS | Industry | Year Ending Q1 2020* | Year Ending Q1 2026 |
|---|---|---|---|
| 321 | Wood Product Manufacturing | 3.73 | 3.21 |
| 3211 | Sawmills & Wood Preservation | 3.44 | 3.42 |
| 3211 | Veneer, Plywood, & Engineered Wood | 3.52 | 3.92 |
| 3219 | Other Wood Product Manufacturing | 3.77 | 3.11 |
| 32191 | Millwork | 4.63 | 3.76 |
| 321911 | Wood Window & Door Manufacturing | 4.88 | 3.86 |
| 32192 | Wood Container & Pallet Manufacturing | 1.75 | 1.51 |
| 32199 | All Other Wood Product Manufacturing | 2.01 | 1.53 |
| 337 | Furniture & Related Product Manufacturing | 0.88 | 0.96 |
Note: These LQs are computed from four-quarter averages and may differ slightly from figures in DEED's Location Quotient Tool, which uses a calendar year period.
Source: Author's calculations from DEED, Quarterly Census of Employment and Wages
Note that Furniture & Related Product Manufacturing is less concentrated than statewide (0.96 LQ). Whether the region's furniture makers gain a competitive advantage from locally produced wood is an open question — they may well be buying from elsewhere. Even so, the industry carries a 2.3% wage premium. It may be that some of the region's talent for wood products, and for manufacturing generally, spills over to support that premium.
Sawmills & Wood Preservation has a strong 3.4 LQ, and even though sawmilling adds less value than downstream millwork, it's a key supplying industry that makes the downstream value added possible. The change in LQ is revealing too. Veneer, Plywood & Engineered Wood gained concentration, as did Furniture. The rest held steady or slipped.
The arithmetic behind those declines is worth stating plainly, because it points somewhere specific. Between 2020's first quarter and 2026's first quarter, statewide Wood Product Manufacturing employment grew 10.1% while Northwest Minnesota's fell 5.2%. Wood Window & Door Manufacturing grew 21.0% statewide and declined 4.3% in the region. These industries are expanding in Minnesota; the expansion is simply happening elsewhere in the state. That's worth watching as an indicator of the region's competitive position.
Three things stand out for practitioners in the region:
Every one of these threads runs back to the same place: workforce. Automation raises skill requirements rather than eliminating them. An aging workforce in a rural region makes replacement demand as consequential as growth demand. And self-employed loggers — along with the contract truckers hauling to the mill — sit outside these counts entirely.
Next month I'll look at who actually does this work in Northwest Minnesota, what those jobs pay and where the hiring pressure is building.
For more information about Forestry & Logging industry employment in Northwest Minnesota, contact Anthony Schaffhasuer at Anthony.schaffhauser@state.mn.us.

