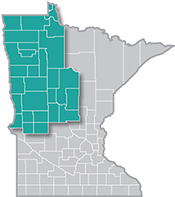
 The presence of such industry powerhouses as Polaris, Arctic Cat and New Flyer make Northwest Minnesota a hub of transportation equipment manufacturing.
From wheat and potatoes to soybeans and sugar beets, the region is a major producer and processor of food staples and specialty agricultural products.
Want the freshest data delivered by email? Subscribe to our regional newsletters.
Strong demand for teachers isn't going away, even as Northwest Minnesota's school enrollment shrinks.
5/20/2026 1:32:47 PM
Anthony Schaffhauser
Northwest Minnesota's schools are caught in a paradox: enrollment is declining, yet the region faces persistent high demand for teachers in nearly every classroom role. Understanding why requires looking past the net job changes to consider retirements and career exits.
Elementary & Secondary Schools employment has trended similarly in Northwest Minnesota and statewide (Figure 1). The Northwest grew 7.5% over the decade compared to 7.9% statewide. The COVID shock hit the Northwest harder, with a 2020 drop of -5.9% versus -4.9% statewide. Yet the Northwest recovered faster, essentially back to its 2019 peak by 2022, while statewide school employment didn't recover until 2023.
Figure 1: Elementary & Secondary Schools Employment, 2015-2025

Source: DEED Quarterly Census of Employment and Wages
Looking at the pre-pandemic trend from 2016 to 2019, Northwest Minnesota Elementary and Secondary School employment grew 2.9%, about the same as Minnesota's 3% growth. However, from 2022 to 2025 the Northwest slowed to 2.1% employment growth while Minnesota statewide grew 2.9%, virtually resuming its pre-pandemic pace.
The net change in Elementary and Secondary Schools employment from 2019 to 2025 looks past the pandemic employment shock and provides a read on the labor market for teachers and paraprofessionals as of the 2025 to 2026 school year. The regions adding the most jobs have the greatest demand, and there are substantial differences throughout the state (Table 1).
| Region
(Ordered by 2022 to 2032 Projected Job Growth) |
2019 | 2025 | 2019 to 2025 Change | 2022 to 2032 Projected Job Growth | |
|---|---|---|---|---|---|
| Number | Percent | ||||
| Seven County Metro | 81,452 | 85,798 | +4,346 | +5.3% | +2.8% |
| Southeast Minnesota | 14,657 | 15,019 | +362 | +2.5% | +0.9% |
| Central Minnesota | 20,014 | 20,545 | +531 | +2.7% | +0.7% |
| Northwest Minnesota | 16,847 | 17,173 | +326 | +1.9% | -0.1% |
| Southwest Minnesota | 11,871 | 11,790 | -81 | -0.7% | -0.5% |
| Northeast Minnesota | 8,006 | 7,760 | -246 | -3.1% | -0.5% |
| Minnesota Statewide | 152,974 | 158,198 | +5,224 | +3.4% | +1.6% |
Source: DEED Quarterly Census of Employment and Wages and Employment Outlook Projections
Table 1 has the regions ordered by projected 2022 to 2032 job growth, and generally the regions that added more jobs and had faster job growth from 2019 to 2025 are projected to grow faster from 2022 to 2032. The employment projections show Northwest Minnesota transitioning from growing to slightly declining employment at Elementary & Secondary Schools, joining the trend of the other rural regions of Southeast and Northeast in the coming years.
Does this mean that demand for teachers and paraprofessionals will soften? The data says no. Demand has been strong, with most teaching occupations having a four- or five-star current demand rating in DEED's /deed/data/data-tools/oid/index.jspOccupations in Demand Tool (Table 2). Please note, "Teaching Assistants, Except Postsecondary" is the standard occupational title for positions commonly known as paraprofessionals.
| SOC Code | Standard Occupational Title | Current Demand Indicator | Median Wage |
|---|---|---|---|
| 252011 | Preschool Teachers | Five Stars | $38,558/yr |
| 252012 | Kindergarten Teachers | Four Stars | $57,723/yr |
| 252021 | Elementary School Teachers | Five Stars | $62,671/yr |
| 252022 | Middle School Teachers | Five Stars | $60,831/yr |
| 252031 | Secondary School Teachers | Five Stars | $62,998/yr |
| 252052 | Special Education Teachers, Kindergarten & Elementary | Four Stars | $62,627/yr |
| 252058 | Special Education Teachers, Secondary | Five Stars | $64,886/yr |
| 253031 | Substitute Teachers, Short-Term | Five Stars | $44,046/yr |
| 259045 | Teaching Assistants, Except Postsecondary | Five Stars | $37,546/yr |
Source: DEED Occupations in Demand Tool
This strong demand for teaching occupations is expected to continue, even despite the slight decline projected for Elementary & Secondary Schools employment. Table 3 shows that teaching occupations are expected to add about 250 jobs, meaning the reductions in staff will come from other positions. Overall, most of the projected total hires are not dependent on growth but instead will come from exit and transfer openings. For example, only 250 of the over 5,700 total projected teacher hires are from new job growth. Over 2,600 are expected from teachers leaving the labor force, most likely due to retirement, while over 2,800 are expected from teachers leaving the profession for a different occupation.
| Standard Occupational Title | Estimated 2022 Employment | Projected 2032 Employment | 2022 to 2032 Projected Change | Labor Force Exit Openings | Occupational Transfer Openings | Total Hires | |
|---|---|---|---|---|---|---|---|
| Number | Percent | ||||||
| All Preschool, Elementary, Middle, Secondary, and Special Education Teachers | 7,645 | 7,892 | +247 | +3.2% | 2,636 | 2,819 | 5,702 |
| Preschool Teachers | 761 | 835 | +74 | +9.7% | 365 | 471 | 910 |
| Kindergarten Teachers | 254 | 261 | +7 | +2.8% | 118 | 152 | 277 |
| Elementary School Teachers | 2,639 | 2,704 | +65 | +2.5% | 897 | 878 | 1,840 |
| Middle School Teachers | 731 | 751 | +20 | +2.7% | 249 | 244 | 513 |
| Secondary School Teachers | 2,075 | 2,133 | +58 | +2.8% | 610 | 679 | 1,347 |
| Career/Technical Education Teachers, Secondary | 73 | 74 | +1 | +1.4% | 21 | 24 | 46 |
| Special Education Teachers, Preschool | 172 | 177 | +5 | +2.9% | 58 | 58 | 121 |
| Special Education Teachers, Kindergarten and Elementary | 277 | 282 | +5 | +1.8% | 94 | 92 | 191 |
| Special Education Teachers, Middle School | 210 | 213 | +3 | +1.4% | 71 | 70 | 144 |
| Special Education Teachers, Secondary | 427 | 434 | +7 | +1.6% | 144 | 142 | 293 |
| Substitute Teachers, Short-Term | 579 | 608 | +29 | +5.0% | 370 | 337 | 736 |
| Teaching Assistants, Except Postsecondary | 4,338 | 4,430 | +92 | +2.1% | 2,499 | 2,592 | 5,183 |
Source: DEED Employment Outlook Projections
The data tells a clear story for workforce professionals and job seekers, in Educational Services and in the economy overall: the challenge in Northwest Minnesota education isn't job growth, it's replacement. This presents durable career opportunities for today's students and career changers.
For more information about employment trends in Northwest Minnesota, contact Anthony Schaffhauser at Anthony.Schaffhauser@state.mn.us.

