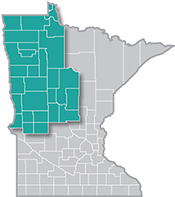
 The presence of such industry powerhouses as Polaris, Arctic Cat and New Flyer make Northwest Minnesota a hub of transportation equipment manufacturing.
From wheat and potatoes to soybeans and sugar beets, the region is a major producer and processor of food staples and specialty agricultural products.
Want the freshest data delivered by email? Subscribe to our regional newsletters.
Women hold the majority of jobs in Northwest Minnesota
3/19/2026 1:32:47 PM
Anthony Schaffhauser
In honor of National Women's History Month, the data tells a story worth telling: women don't just participate in Northwest Minnesota's economy, they carry the lions share of employment.
According to the Census Bureau's American Community Survey 2020–2024 5-Year estimates, an estimated 230,115 women age 16 and over live in Northwest Minnesota. Nearly 59% are in the labor force — including those who are unemployed or self-employed — compared to 62.5% for the overall population. Women also have a lower unemployment rate (3.9%) than the overall regional average (4.4%).
Focusing on wage and salary employment, the Quarterly Workforce Indicators (QWI) show that women held 115,833 jobs in the region in the second quarter of 2025 — 52.2% of all Northwest Minnesota jobs (Figure 1). And this isn't new: women have filled the majority of regional jobs every year since QWI data began in 1995. That's a remarkable, sustained contribution to the regional economy.
Figure 1: Northwest Minnesota Employment and Female Employment, Second Quarter 1995 to Second Quarter 2025

Source: Quarterly Workforce Indicators
The 2008 financial crisis triggered widespread job losses. From 2008 to 2009, total regional employment fell 3.4%, but female employment dropped only 1.6%. Many women entered or re-entered the workforce to offset lost household income, pushing women's share of employment to a peak of 55.3% in 2009.
COVID-19 created a different kind of disruption. Childcare providers, schools and eldercare providers faced closures, staffing crises and discontinuity of services. Women disproportionately stepped back from paid work to care for children and aging parents. As I stated in a /deed/newscenter/publications/trends/march-2024/index.jspcomprehensive analysis of Minnesota's labor force dynamics, "Caregiving is the plausible explanation for the lower rate of females in the workforce" and in earlier regional blogs tracking Northwest Minnesota through 2023 and 2024. A
That caregiving impact is still visible in the most recent data (Table 1):
| Year to Second Quarter* | Change 2019-2025 | |||
|---|---|---|---|---|
| 2019 | 2025 | Number | Percent | |
| Female | 116,603 | 117,538 | 935 | 0.8% |
| 14-18 | 5,478 | 7,028 | 1,550 | 28.3% |
| 19-21 | 6,486 | 6,641 | 155 | 2.4% |
| 22-24 | 6,196 | 6,040 | -157 | -2.5% |
| 25-34 | 21,622 | 20,262 | -1,361 | -6.3% |
| 35-44 | 22,871 | 24,435 | 1,564 | 6.8% |
| 45-54 | 22,266 | 22,165 | -101 | -0.5% |
| 55-64 | 23,673 | 20,936 | -2,737 | -11.6% |
| 65-99 | 8,011 | 10,032 | 2,021 | 25.2% |
| Male | 106,442 | 110,698 | 4,256 | 4.0% |
| 14-18 | 4,523 | 5,584 | 1,061 | 23.5% |
| 19-21 | 5,724 | 6,100 | 376 | 6.6% |
| 22-24 | 6,105 | 6,000 | -105 | -1.7% |
| 25-34 | 21,761 | 21,223 | -538 | -2.5% |
| 35-44 | 21,481 | 23,504 | 2,023 | 9.4% |
| 45-54 | 19,321 | 20,074 | 752 | 3.9% |
| 55-64 | 19,514 | 18,371 | -1,143 | -5.9% |
| 65-99 | 8,014 | 9,845 | 1,830 | 22.8% |
| Total, All | 223,045 | 228,236 | 5,191 | 2.3% |
| *Average of four quarters from third quarter 2018 to second quarter 2019 and from third quarter 2024 to second quarter 2025. | ||||
Source: Quarterly Workforce Indicators
The U.S. public health emergency ended in the second quarter of 2023. Women's share of regional employment ticked up from 52.0% to 52.3% that year — but has since plateaued and edged back to 2021 levels in 2025.
A trendline added to Figure 1, starting in 2013 (when employment first recovered to pre-recession levels), shows a gradual decline in women's share of jobs through 2025. It's possible the pandemic effects are now as resolved as they're going to be, and women's employment share is settling closer to — though still above — that of men.
Whether or not that trend holds, the contributions of women to Northwest Minnesota's economy are, and have long been, extraordinary.
For more information about employment changes in Northwest Minnesota, contact Anthony Schaffhauser at Anthony.Schaffhauser@state.mn.us.

