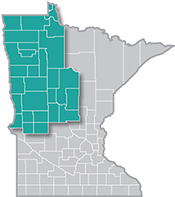
 The presence of such industry powerhouses as Polaris, Arctic Cat and New Flyer make Northwest Minnesota a hub of transportation equipment manufacturing.
From wheat and potatoes to soybeans and sugar beets, the region is a major producer and processor of food staples and specialty agricultural products.
Want the freshest data delivered by email? Subscribe to our regional newsletters.
New survey results from workforce professionals and statistics from DEED’s Labor Market Information Office paint a nuanced picture: The job market is loosening, but is that a good thing?
2/20/2026 1:32:47 PM
Anthony Schaffhauser
New survey results from workforce professionals and statistics from /deed/data/index.jspDEED's Labor Market Information Office paint a nuanced picture: The job market is loosening, but is that a good thing? How hard is it to find a job in Northwest Minnesota right now? To answer that question, we can look at two complementary sources: insights from the workforce professionals who work directly with job seekers, and the "hard" labor market data from DEED.
In July 2025, DEED launched the /deed/data/data-tools/job-search-experience/index.jspJob Search Experience Survey (JSES) to poll workforce development professionals in the CareerForce system. In Northwest Minnesota, these professionals are DEED staff and employees of Rural Minnesota Concentrated Employment Program (RMCEP) and Inter-County Community Council. Working with thousands of job seekers every year, they have a first-hand view of what's happening in the job market. Figure 1 has the results for how easily job-seeking clients found employment.
Figure 1: Northwest Minnesota Job Seeker Experience Survey Results:
"On average, compared to 1 year ago, how would you rate the ease with which your job-seeking clients are finding employment?"

Source: DEED /deed/data/data-tools/job-search-experience/index.jspJob Search Experience Survey
Results from July 2025 showed a difficult job-seeking environment:
These results correspond with my August blog statement that "job seekers face a more challenging environment."
The newly released January 2026 results show a shift, though not necessarily improvement:
It's important context to point out that respondents are asked to compare to the same month in the prior year (July 2025 vs. July 2024 and January 2026 vs. January 2025). This is by design because Minnesota's job market – and Northwest Minnesota in particular – has dramatic seasonal swings, particularly in hospitality and construction. Respondents were not asked to compare July to January directly.
Nonetheless, there is a notable shift from July 2025 to January 2026 to "about the same" and "somewhat harder." Very few January 2026 respondents believe it is easier to find employment than it was one year ago. While 50% of January responses were "about the same," (up from 37% in July) most of the remaining January respondents (42%) judged it "somewhat harder."
My take on the January results compared to July: it's not easier, but not much harder either. Fewer respondents were seeing dramatic deterioration, but almost nobody sees improvement.
Does the quantitative labor market data support this assessment? Yes, but it also shows the labor market progressively loosening over the months. It's also important to note that's something the survey with its "compared to 1 year ago" qualifier was not designed to show, at least not until we get annual results to compare. However, like the survey, the data also does not show a collapsing labor market.
Unemployment in the region is rising, suggesting more people are actively seeking work. The 2025 unemployment rate exceeded 2024 levels in every single month, and the gap is widening (Figure 2). The first half of 2025 averaged 0.5 percentage point higher than 2024, while the second half jumped to 1.2 points higher (excluding October in both years due to the federal shutdown preventing October 2025 estimates).
Figure 2: Northwest Minnesota Unemployment Rate, 2024 and 2025

Note: October 2025 estimate was not produced due to Federal Government shutdown.
Source: DEED /deed/data/data-tools/laus/index.jspLocal Area Unemployment Statistics
Even more notable is that December 2025 had the highest unemployment rate of any month. This is rare; looking back as far as 1990, the unemployment peak has almost always occurred in January or February – the dead of winter – with only three exceptions:
A quick reminder of the less dramatic 2016 slowdown: Nationally, mining & extraction and manufacturing employment dipped. Northwest Minnesota manufacturing employment followed suit, dropping by over 1% in second quarter compared to second quarter 2015, and continuing down in the third and fourth quarters, according to /deed/data/data-tools/qcew/index.jspDEED's Quarterly Census of Employment and Wages (QCEW).
Let's hope December 2025's unemployment rate was an anomaly brought on by the extreme swing to colder-than-normal weather, or at worst a three-quarter manufacturing slowdown like 2016 – and not a recession signal.
Unlike the 2016 slowdown, which was concentrated in manufacturing, this softening is broader and employment overall is declining. DEED's QCEW shows total employment down slightly in all three quarters of 2025 compared to 2024 (Table 1).
| Table 1: Over-the-Year Change in Northwest Minnesota Total Employment | ||||
|---|---|---|---|---|
| 2024 Jobs | 2025 Jobs | Over-the-Year Change | ||
| Jobs | Percent | |||
| First Quarter | 218,101 | 217,921 | -180 | -0.1% |
| Second Quarter | 231,509 | 230,153 | -1,356 | -0.6% |
| Third Quarter | 231,277 | 229,542 | -1,735 | -0.8% |
| Source: DEED, Quarterly Census of Employment and Wages | ||||
Not only have we seen three consecutive quarters of job losses, but the declines are progressively larger. This points to a more systemic issue than just bad December weather. This is where bringing together workforce professionals' qualitative insights and DEED's quantitative data becomes invaluable. The QCEW employment figures look most concerning. The unemployment rate looks somewhat concerning. But the workforce professionals on the ground – those working daily with job seekers – are mostly seeing an unchanged to somewhat harder environment as of January 2026, not a dramatic deterioration.
I'll be watching the monthly and quarterly data closely to see whether the market stabilizes, improves or continues to soften.
For more information about Northwest Minnesota's changing economy, contact Anthony Schaffhauser at Anthony.Schaffhauser@state.mn.us.

