skip to content
Primary navigation

Minnesota county human service cost dashboard

Total human service costs

It is the "big picture" of statewide county human services fiscal activity and is designed to present a fair and consistent representation of the costs and revenue sources involved in providing human service programs administered by the counties and supervised by DHS.

The dashboards contain data on total human service costs, total human services revenue share, all program costs, costs and revenue shares by category as well as detailed data on the three major program divisions: Support, Health and Social Services. In addition to expense and revenue data, the report also provides notes and technical remarks, graphical overviews, trend data and per capita comparative data.

County cost dashboards:

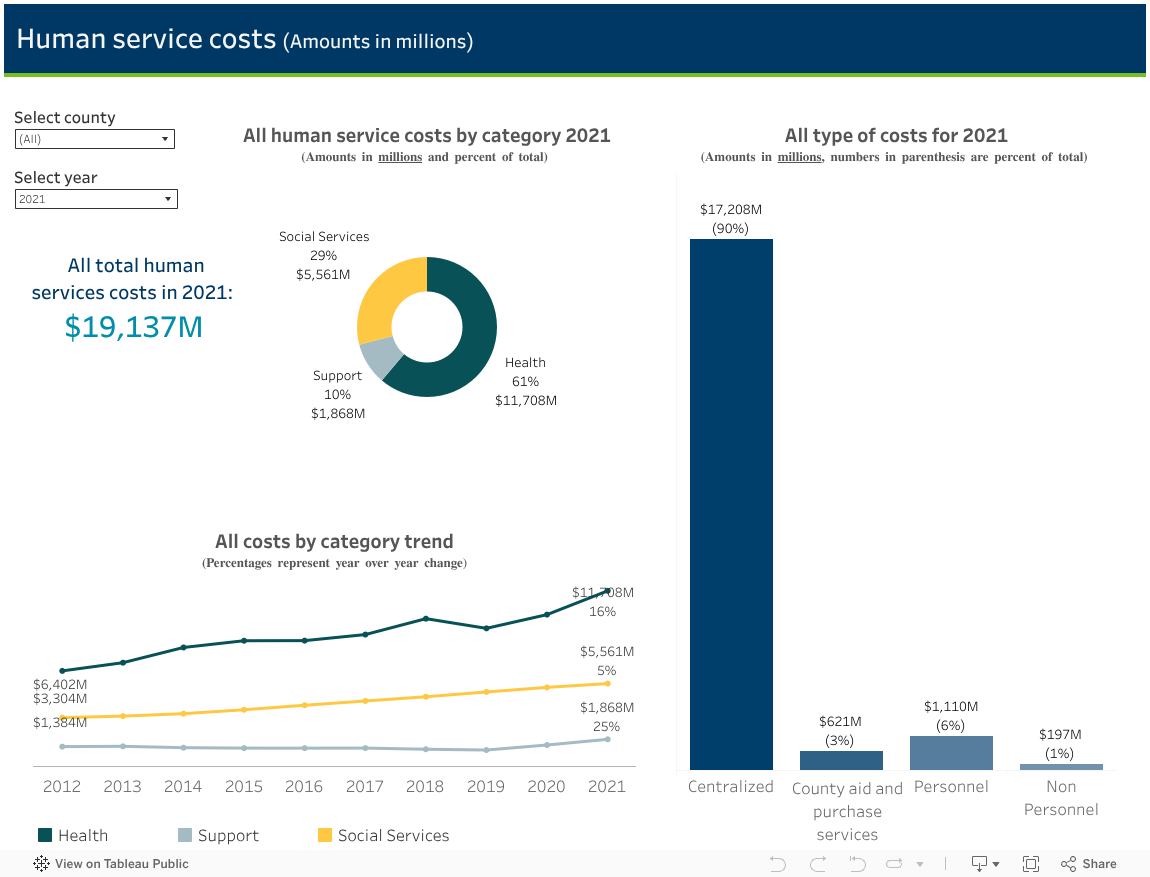
*Support Programs: Minnesota Supplemental Aid, Minnesota Family Investment Program, General Assistance MFIP, GA, Supplemental Nutrition Assistance Program, Child Support Enforcement and Housing. Health Programs: Medical Assistance. 

Social Services: Children's Services, Child Care, Chemical Dependency, Mental Health, Development Disabilities and Adult Services


Definitions 

Data Definitions: The purpose of the Minnesota County Human Service Cost Report is to provide a fair representation of the costs and revenue sources involved in providing human service programs administered by the counties and supervised by the Minnesota Department of Human Services (DHS). 

Alternative formats

Data format

To access underlying data for the visualization above, you can download CSV files for the following:

Table 1 - Total human services cost and revenue shares (Excel) Table 15 - Mental health costs and revenue shares (Excel)
Table 2 - Total support programs cost and revenue shares (Excel) Table 16 - Developmental Disabilities (DD) costs and revenue shares (Excel) 
Table 3 - Minnesota Supplemental Aid (MSA) costs and revenue shares (Excel) Table 17 - Adult services costs and revenue shares (Excel)
Table 4 - Minnesota Family Investment Program (MFIP/TANF) costs and revenue shares (Excel) Table 18 - State shared revenues for human services (Excel)
Table 5 - General Assistance (GA) costs and revenue shares (Excel) Table 19 - MinnesotaCare claims, clients and service costs (Excel)
Table 6 - Supplemental Nutrition Assistance Program (SNAP) costs and revenue shares (Excel) Table 20 - Human services aid, purchased services and administrative cost trends (Excel)
Table 7 - Child Support Enforcement (Title IV-D) costs and revenue shares (Excel) Table 21 - Support programs aid and administrative cost trends (Excel)
Table 8 - Group Residential Housing (GRH) costs and revenue shares (Excel) Table 22 - Health programs aid and administrative cost trends (Excel)
Table 9 - Total health programs cost and revenue shares (Excel) Table 23 - Social service programs aid and administrative cost trends (Excel)
Table 10 - Medical assistance (MA) costs and revenue shares (Excel)  Table 24 - Total human services comparative data - per capita ranking by total cost (Excel)
Table 11 - Total social services costs and revenue shares (Excel) Table 25 - Support programs comparative data - per capita ranking by total cost (Excel)
Table 12 - Children's services costs and revenue shares (Excel) Table 26 - Health programs comparative data - per capita ranking by total cost (Excel)
Table 13 - Child care costs and revenue shares (Excel)  Table 27 - Social service programs comparative data - per capita ranking by total cost (Excel)
Table 14 - Chemical dependency (CD) costs and revenue shares (Excel)

County Reports

Minnesota County Human Service Cost Reports CY2019 - CY2009

 
back to top