skip to content
Primary navigation

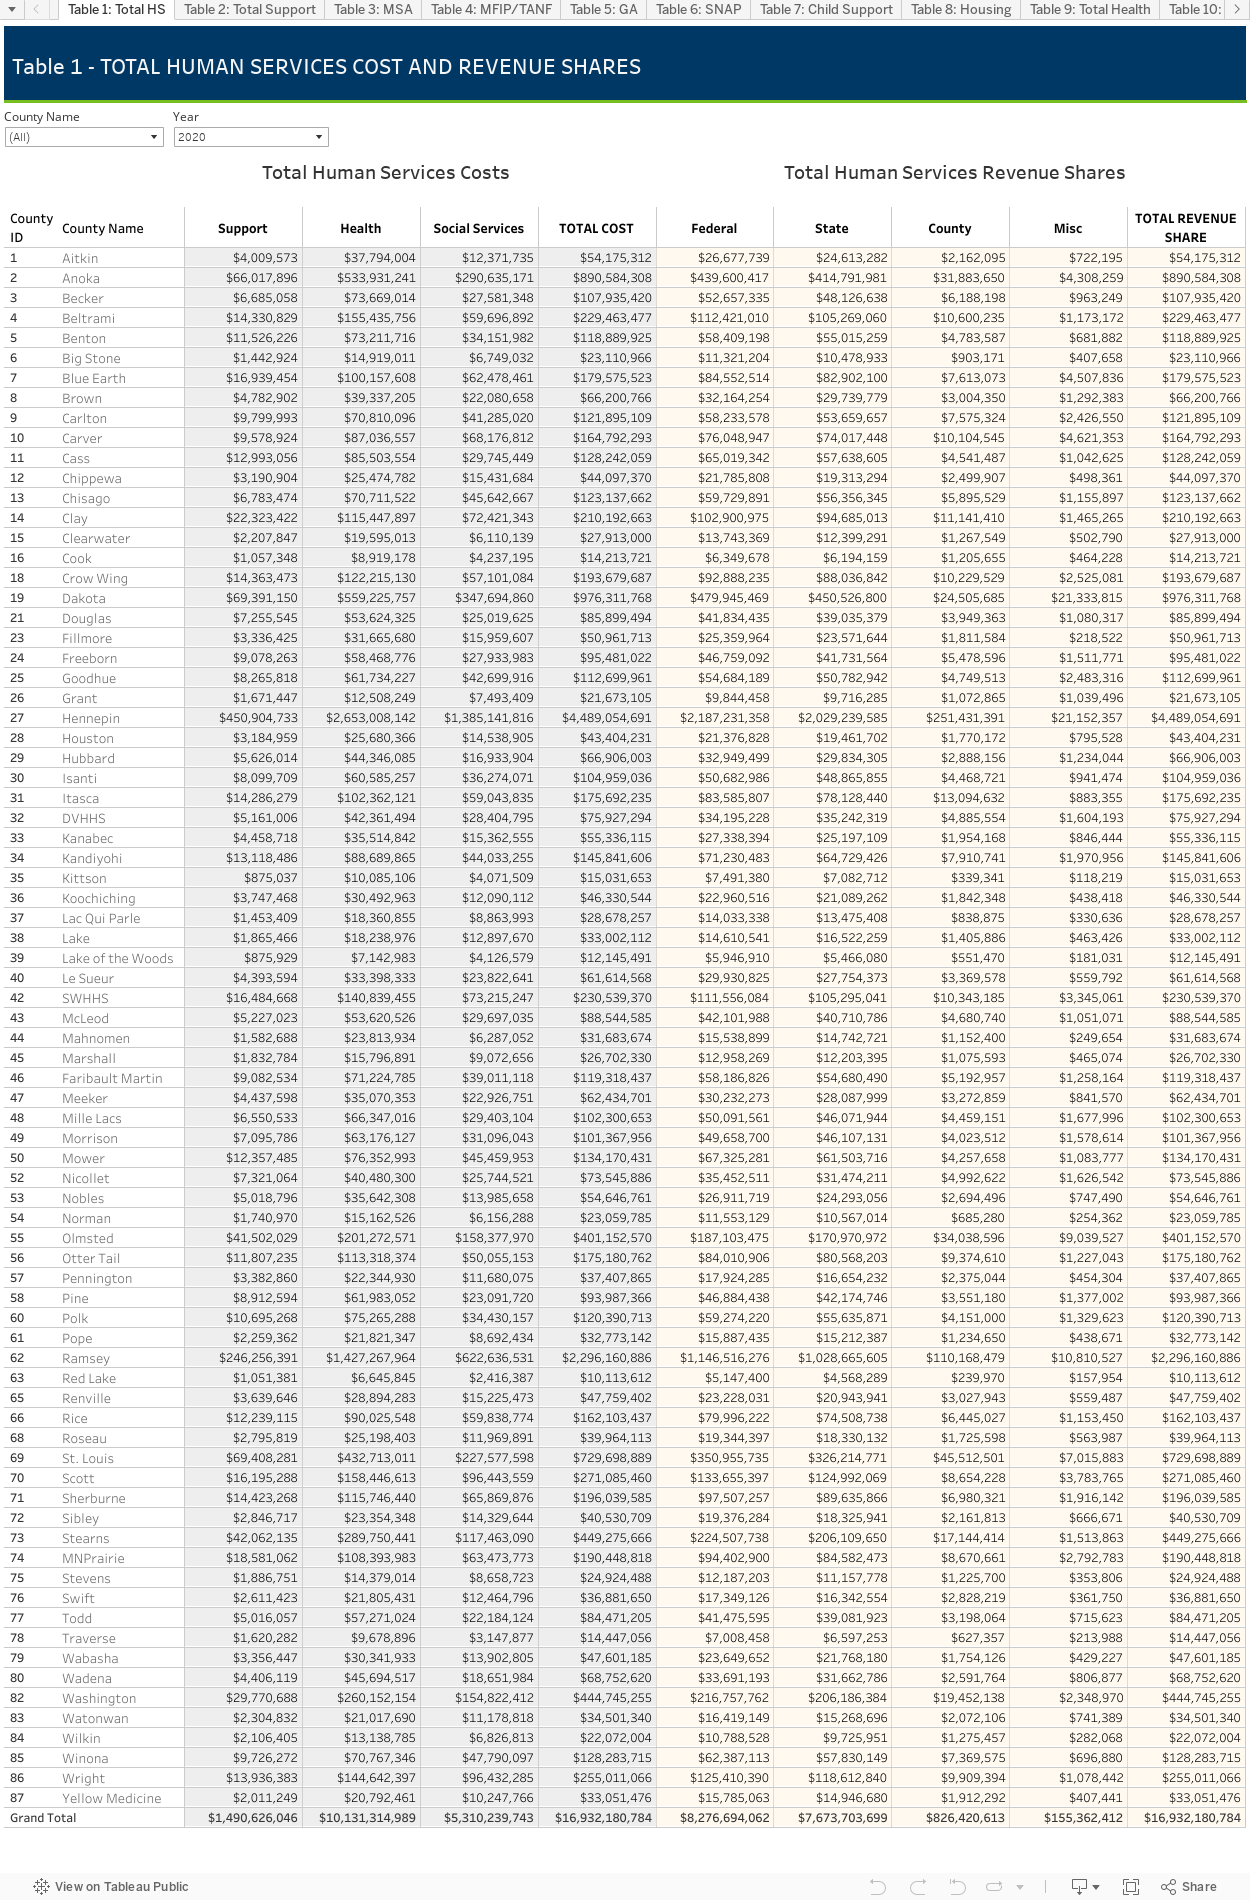
Minnesota county human service cost dashboard

Total human service cost and revenue tables; and supplemental and trend data

These tables cover the data by a predefined topic and county. Tables 2 through 17 are program data. These tables cover the Support, Health and Social Service program components and are laid out essentially the same.  Tables 18 and 19 show supplemental data. Table 18 reports state shared revenue received by counties from state agencies other than DHS. Table 19 lists MinnesotaCare costs, number of clients and number of claims by county of residence. This data is included to provide a more complete picture of human service activity. 

Tables 20 through 23 are trend data tables that contain trend data derived from the preceding tables and prior reports. The track program changes from years 2016 – 2019. Tables 24 through 27 report comparative per capita costs and revenue share using the 2019 program data and estimated populations. The Per Capita Ranking column lists counties' “TOTAL” cost per capita ranking (least to highest).

County cost dashboards:

Notes

Tables 2 through 17 are program data. These tables cover the Support, Health and Social Service program components and are laid out essentially the same. 

Tables 18 – 19 show supplemental data. Table 18 reports state shared revenue received by counties from state agencies other than the Minnesota Department of Human Services. Table 19 lists MinnesotaCare costs, number of clients and number of claims by county of residence. This data is included to provide a more complete picture of human service activity.

Tables 20 - 23 are trend data tables that contain trend data derived from the preceding tables and prior reports. The track program changes from years 2016 – 2019.

Tables 24 – 27 report comparative per capita costs and revenue share using the 2019 program data and estimated populations. The Per Capita Ranking column lists counties “TOTAL” cost per capita ranking (least to highest).

Alternative formats

Data format

To access underlying data for the visualization above, you can download CSV files for the following:

Table 1 - Total human services cost and revenue shares (Excel) Table 15 - Mental health costs and revenue shares (Excel)
Table 2 - Total support programs cost and revenue shares (Excel) Table 16 - Developmental Disabilities (DD) costs and revenue shares (Excel) 
Table 3 - Minnesota Supplemental Aid (MSA) costs and revenue shares (Excel) Table 17 - Adult services costs and revenue shares (Excel)
Table 4 - Minnesota Family Investment Program (MFIP/TANF) costs and revenue shares (Excel) Table 18 - State shared revenues for human services (Excel)
Table 5 - General Assistance (GA) costs and revenue shares (Excel) Table 19 - MinnesotaCare claims, clients and service costs (Excel)
Table 6 - Supplemental Nutrition Assistance Program (SNAP) costs and revenue shares (Excel) Table 20 - Human services aid, purchased services and administrative cost trends (Excel)
Table 7 - Child Support Enforcement (Title IV-D) costs and revenue shares (Excel) Table 21 - Support programs aid and administrative cost trends (Excel)
Table 8 - Group Residential Housing (GRH) costs and revenue shares (Excel) Table 22 - Health programs aid and administrative cost trends (Excel)
Table 9 - Total health programs cost and revenue shares (Excel) Table 23 - Social service programs aid and administrative cost trends (Excel)
Table 10 - Medical assistance (MA) costs and revenue shares (Excel)  Table 24 - Total human services comparative data - per capita ranking by total cost (Excel)
Table 11 - Total social services costs and revenue shares (Excel) Table 25 - Support programs comparative data - per capita ranking by total cost (Excel)
Table 12 - Children's services costs and revenue shares (Excel) Table 26 - Health programs comparative data - per capita ranking by total cost (Excel)
Table 13 - Child care costs and revenue shares (Excel)  Table 27 - Social service programs comparative data - per capita ranking by total cost (Excel)
Table 14 - Chemical dependency (CD) costs and revenue shares (Excel)

County Reports

Minnesota County Human Service Cost Reports CY2019 - CY2009

 
back to top