skip to content

Minnesota county human service cost dashboard

Total human service costs and revenue shares by category

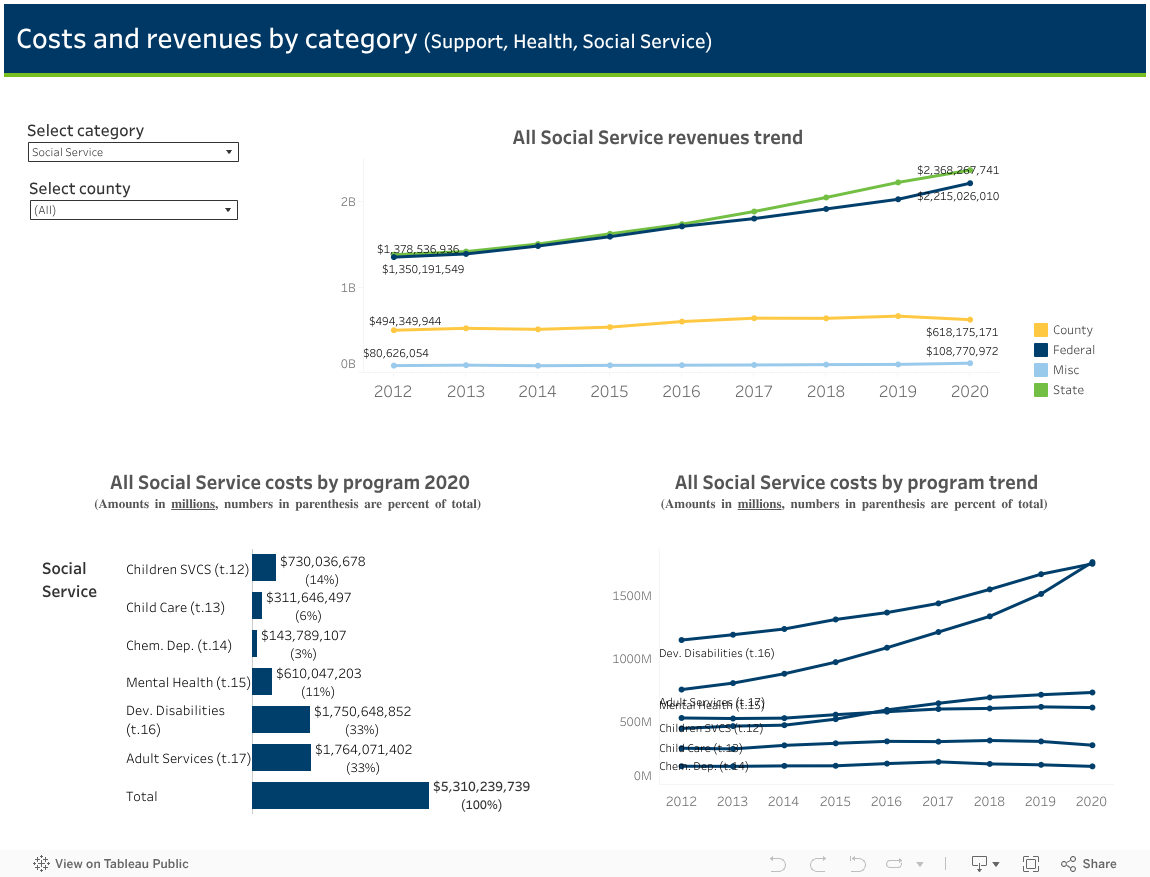
This dashboard shows the revenue (federal, state, county and miscellaneous) for the three program areas – Support, Health and Social Service program costs. The revenue trend is shown at the revenue source total (County, Federal, Misc. and State) level.

Costs by the main program areas – Support, Health and Social Service program displays each program under the main program area. Also displayed is a cost by program trend table.

County cost dashboards:

Alternative formats

Data format

To access underlying data for the visualization above, you can download CSV files for the following:

Table 1 - Total human services cost and revenue shares (Excel) Table 15 - Mental health costs and revenue shares (Excel)
Table 2 - Total support programs cost and revenue shares (Excel) Table 16 - Developmental Disabilities (DD) costs and revenue shares (Excel) 
Table 3 - Minnesota Supplemental Aid (MSA) costs and revenue shares (Excel) Table 17 - Adult services costs and revenue shares (Excel)
Table 4 - Minnesota Family Investment Program (MFIP/TANF) costs and revenue shares (Excel) Table 18 - State shared revenues for human services (Excel)
Table 5 - General Assistance (GA) costs and revenue shares (Excel) Table 19 - MinnesotaCare claims, clients and service costs (Excel)
Table 6 - Supplemental Nutrition Assistance Program (SNAP) costs and revenue shares (Excel) Table 20 - Human services aid, purchased services and administrative cost trends (Excel)
Table 7 - Child Support Enforcement (Title IV-D) costs and revenue shares (Excel) Table 21 - Support programs aid and administrative cost trends (Excel)
Table 8 - Group Residential Housing (GRH) costs and revenue shares (Excel) Table 22 - Health programs aid and administrative cost trends (Excel)
Table 9 - Total health programs cost and revenue shares (Excel) Table 23 - Social service programs aid and administrative cost trends (Excel)
Table 10 - Medical assistance (MA) costs and revenue shares (Excel)  Table 24 - Total human services comparative data - per capita ranking by total cost (Excel)
Table 11 - Total social services costs and revenue shares (Excel) Table 25 - Support programs comparative data - per capita ranking by total cost (Excel)
Table 12 - Children's services costs and revenue shares (Excel) Table 26 - Health programs comparative data - per capita ranking by total cost (Excel)
Table 13 - Child care costs and revenue shares (Excel)  Table 27 - Social service programs comparative data - per capita ranking by total cost (Excel)
Table 14 - Chemical dependency (CD) costs and revenue shares (Excel)

County Reports

Minnesota County Human Service Cost Reports CY2019 - CY2009

 
back to top