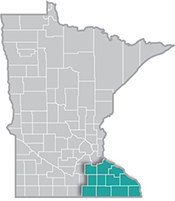
 Southeast Minnesota is a health care and agricultural powerhouse. The region is home to the renowned Mayo Clinic and some of the world's most recognized food companies and brands.
Advanced manufacturing is especially strong here, with machinery, chemicals, and electronics among the top products.
Want the freshest data delivered by email? Subscribe to our regional newsletters.
Every year, Minnesota collects detailed wage and employment information for approximately 800 occupations
12/31/2025 10:55:08 AM
Amanda Blaschko
Every year, Minnesota collects detailed wage and employment information for approximately 800 occupations through the /deed/data/data-tools/oes/index.jspOccupational Employment & Wage Statistics (OEWS) survey. This data helps job seekers understand earning potential, assists employers in setting competitive wages, and guides workforce development decisions. But if you've never used it before, how do you interpret this data?
The OEWS survey samples establishments across Minnesota to gather information on full-time and part-time workers who receive wages or salaries. The wages reported include base pay, commissions, production bonuses, cost-of-living allowances, hazardous-duty pay and tips. What's not included are things like overtime pay, shift differentials and benefits like health insurance or retirement contributions.
One of the strengths of OEWS data is that it's available at multiple geographic levels. You can look at statewide wage data that covers all of Minnesota, compare it to nationwide figures, or drill down to more specific areas like planning regions, economic development regions, metropolitan statistical areas, or the balance of the region outside metro areas. This allows you to see how wages for the same occupation might vary between different parts of the state. It's worth noting that some occupations might be suppressed in certain geographies due to confidentiality reasons to protect employer privacy.
When you look at OEWS data, you'll see several wage figures for each occupation. While the mean (average) wage is included, percentiles give you a much clearer picture of how wages are distributed. Think of percentiles as markers along a line of workers arranged from lowest-paid to highest-paid.
The 10th percentile tells you that 10% of workers in that occupation earn less than this amount, while 90% earn more. This often represents entry-level wages. The 25th percentile means that 25% of workers earn less and 75% earn more, typically reflecting workers with limited experience. The median, or 50th percentile, is the middle point where half of all workers earn less, and half earn more. This is often the most useful single number because it isn't skewed by extremely high or low wages. The 75th percentile represents experienced workers or those in more senior positions, while the 90th percentile captures only the top 10% of earners.
Let's look at Southeast Minnesota's first quarter 2025 data for Construction Laborers (Figure 1). This occupation includes workers who perform physical labor at construction sites, operate hand and power tools, clean and prepare sites, and assist other craft workers. Southeast Minnesota employs about 2,040 construction laborers with a mean wage of $27.84 per hour.
Figure 1. Construction Laborer Wage Data

At the 10th percentile, Construction Laborers earned $18.99 per hour, representing entry-level workers. At the 25th percentile, workers were paid $22.35 per hour, while the median wage is $27.37 per hour. The 75th percentile wage is $30.89 per hour for workers with specialized skills or several years of experience, and the 90th percentile is $39.53 per hour for the most experienced workers.
There's about a $20 per hour difference between the 10th and 90th percentiles. This tells us that Construction Laborer is an occupation where experience and skills can significantly increase earning potential over time.
In competitive labor markets like we're seeing in Southeast Minnesota's construction industry, employers who want to attract qualified workers often need to offer wages closer to the median or into the upper half of the distribution. If an employer was offering $20 per hour, they'd be below even the 25th percentile, meaning 75% of construction laborers in Southeast Minnesota earn more than what that business is offering.
Understanding percentiles helps everyone see the complete picture of an occupation's earning potential. The median tells you what's typical but looking at the full range shows you realistic entry points, what you might earn with experience and the ceiling for top performers.
For more information about wages in Southeast Minnesota, contact Amanda Blaschko at Amanda.Blaschko@state.mn.us.
