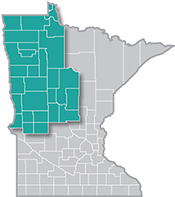
 The presence of such industry powerhouses as Polaris, Arctic Cat and New Flyer make Northwest Minnesota a hub of transportation equipment manufacturing.
From wheat and potatoes to soybeans and sugar beets, the region is a major producer and processor of food staples and specialty agricultural products.
Want the freshest data delivered by email? Subscribe to our regional newsletters.
While total employment is higher since COVID-19, the workers filling the jobs look remarkably different than they did five years ago
12/31/2025 1:32:47 PM
Anthony Schaffhauser
While total employment is higher since COVID-19, the workers filling the jobs look remarkably different than they did five years ago.
The story of Northwest Minnesota's employment recovery isn't just about numbers surpassing pre-pandemic levels – it's about who is doing the work. New data reveals a fundamental shift: the region's workforce is becoming dramatically more racially diverse, with communities of color now driving all net employment growth while the White workforce contracts. This transformation, accelerated by the pandemic, has profound implications for workforce development, recruitment strategies, and regional economic planning.
Quarterly Workforce Indicators (QWI) track employment by demographic characteristics of workers. With first quarter 2025 data recently released, we can see how workforce demographics have changed since COVID-19 hit in first quarter 2020. To eliminate seasonal fluctuations, we compare average annual employment for four quarters from second quarter through first quarter, or "year ending first quarter" (see Table 1.)
|
Table 1: Change in Northwest Minnesota Employment by Race and Ethnicity Since the Pandemic |
||||
|---|---|---|---|---|
| Race or Ethnic Group | Year Ending First Quarter | Change 2020-2025 | ||
| 2020 | 2025 | Number | Percent | |
| White Alone | 202,038 | 201,370 | -668 | -0.3% |
| Black or African American Alone | 3,354 | 4,267 | +914 | +27.2% |
| American Indian or Alaska Native Alone | 6,524 | 6,263 | -261 | -4.0% |
| Asian Alone | 2,356 | 2,845 | +489 | +20.8% |
| Native Hawaiian or Other Pacific Islander Alone | 129 | 151 | +22 | +17.1% |
| Two or More Race Groups | 3,402 | 3,985 | +583 | +17.1% |
| Hispanic or Latino (of any race) | 7,807 | 10,214 | +2,407 | +30.8% |
| Black, Indigenous, People of Color (BIPOC) | 23,572 | 27,725 | +4,154 | +17.6% |
| Total, All Races, All Ethnicities | 225,609 | 229,095 | +3,486 | +1.5% |
|
Source: Quarterly Workforce Indicators |
||||
The numbers tell a striking story: Northwest Minnesota has added 3,486 jobs (1.5% growth) since the pandemic began. But the region's largest workforce cohort – White Alone jobholders – actually declined by 668 jobs. Instead, all job gains came from workers of color.
Hispanic or Latino workers led the growth in the region with 2,407 additional jobs (+30.8%), followed by Black or African American Alone workers filling 914 net new jobs (+27.2%). The number of jobs held by Asian Alone workers grew by 20.8%, and jobs for workers identifying as Two or More Race Groups increased by 17.1%. The one exception to growth among communities of color was American Indian or Alaska Native Alone workers, whose employment fell 4.0% (a decline we'll explore later).
This increasing workforce diversity didn't start with COVID-19, but it has accelerated since. The trend has been building for years, driven by the region's changing demographics (see Table 2.)
| Table 2: Change in Northwest Minnesota Employment by Race and Ethnicity in the Five Years Before the Pandemic | ||||
|---|---|---|---|---|
| Race or Ethnic Group | Year Ending First Quarter | Change 2015-2020 | ||
| 2015 | 2020 | Number | Percent | |
| White Alone | 200,594 | 202,038 | +1,444 | +0.7% |
| Black or African American Alone | 2,244 | 3,354 | +1,110 | +49.4% |
| American Indian or Alaska Native Alone | 6,142 | 6,524 | +383 | +6.2% |
| Asian Alone | 2,071 | 2,356 | +286 | +13.8% |
| Native Hawaiian or Other Pacific Islander Alone | 93 | 129 | +36 | +38.3% |
| Two or More Race Groups | 2,806 | 3,402 | +596 | +21.2% |
| Hispanic or Latino (of any race) | 5,846 | 7,807 | +1,961 | +33.5% |
| Black, Indigenous, People of Color (BIPOC) | 19,201 | 23,572 | +4,370 | +22.8% |
| Total, All Races, All Ethnicities | 219,795 | 225,609 | +5,814 | +2.6% |
| Source: Quarterly Workforce Indicators | ||||
In the five years before the pandemic, every workforce group grew faster than White Alone workers. The Hispanic workforce alone added more jobs (1,961) than the White Alone workforce (1,444), while Black or African American Alone employment nearly doubled with 49.4% growth.
The pandemic fast-tracked this transformation. White Alone employment, which grew 0.7% before COVID-19, has since declined -0.3%. The pandemic also marked other workforce demographic changes. American Indian or Alaska Native Alone employment, which grew 6.2% before the pandemic, has fallen -4.0% since. Meanwhile, Asian Alone workers are the only group experiencing faster growth post-pandemic (+20.8%) than pre-pandemic (+13.8%).
Why is White Alone employment declining? The answer lies in the region's age distribution. According to Census Bureau Population Estimates, from April 2020 to July 2024, the White Alone population age 65 and over increased by 12,517 people (from 114,686 to 127,203) in the region. As a percentage of the 15-and-over population, this represents a 2.5 percentage point increase—from 27.3% in 2020 to 29.8% in 2024.
This was the highest increase of any racial and ethnic group except Asian Alone, which also saw a 2.5 percentage point increase. American Indian or Alaska Native Alone experienced a 1.7 percentage point increase, while all other groups increased less than 1 percentage point. In other words, as White workers retire, younger workers of color are replacing them.
The 25-to-54-year-old age group – called the "prime working age" because labor force participation peaks during these years – shows how population trends drive employment patterns (see Table 3.)
| Table 3: Change in Northwest Minnesota Age 25 to 54 Population by Race and Ethnicity After the Pandemic | ||||
|---|---|---|---|---|
| Race or Ethnic Group | Month Year | Change | ||
| April 2020 | July 2024 | Number | Percent | |
| White Alone | 168,317 | 167,888 | -429 | -0.3% |
| Black or African American Alone | 3,045 | 3,849 | +804 | +26.4% |
| American Indian or Alaska Native Alone | 7,787 | 7,928 | +141 | +1.8% |
| Asian Alone | 1,782 | 1,990 | +208 | +11.7% |
| Native Hawaiian or Other Pacific Islander Alone | 116 | 137 | +21 | +18.1% |
| Two or More Race Groups | 2,927 | 3,387 | +460 | +15.7% |
| Hispanic or Latino (of any race) | 6,858 | 8,837 | +1,979 | +28.9% |
| Black, Indigenous, People of Color (BIPOC) | 22,515 | 26,128 | +3,613 | +16.0% |
| Total, All Races, All Ethnicities | 190,832 | 194,016 | +3,184 | +1.7% |
| Source: U.S. Census Bureau Population Estimates | ||||
The White Alone employment decline of 0.3% perfectly tracks the 0.3% decline in the prime working age White Alone population. For most other groups, employment growth closely mirrors prime working age population growth.
Two groups stand out as exceptions:
What explains the Asian Alone workforce participation increase? Unfortunately, available data cannot answer this question.
One possibility: Asian Alone individuals may be moving to the region for jobs while retired Asian Alone individuals move away, boosting workforce participation rates. However, migration data by race is unavailable to test this hypothesis.
Another factor: Asian Alone has the fastest growth in the 65- to 69-year-old age group. If Asian Alone workforce participation is higher in this age bracket, it would have an outsized impact on employment. Unfortunately, QWI does not provide employment data broken down by both age and race/ethnicity, making this hypothesis untestable as well.
Unlike the Asian Alone increase, the reason for lower American Indian or Alaska Native Alone workforce participation is clear from industry sector data.
American Indian employment is concentrated in three sectors that were hit particularly hard by the pandemic and have not recovered:
| Table 4: Change in American Indian Alone Employment in Select Industry Sectors After the Pandemic | ||||
|---|---|---|---|---|
| Industry Sector | Year Ending First Quarter | Change | ||
| 2020 | 2024 | Jobs | Percent | |
| All NAICS Sectors | 6,524 | 6,263 | -261 | -4.0% |
| Public Administration | 1,824 | 1,458 | -366 | -20.1% |
| Accommodation & Food Services | 1,311 | 1,134 | -177 | -13.5% |
| Health Care & Social Assistance | 797 | 938 | +142 | +17.8% |
| Retail Trade | 546 | 638 | +92 | +16.9% |
| Educational Services | 507 | 522 | +15 | +3.0% |
| Arts, Entertainment, & Recreation | 616 | 434 | -183 | -29.6% |
| Manufacturing | 256 | 310 | +53 | +20.8% |
| Construction | 160 | 229 | +70 | +43.6% |
| Wholesale Trade | 97 | 106 | +9 | +9.0% |
| Other Services | 68 | 97 | +30 | +44.1% |
| All Ten Other Sectors Combined | 345 | 399 | +54 | +15.7% |
| Source: Quarterly Workforce Indicators | ||||
The three hardest-hit sectors lost 726 American Indian or Alaska Native Alone jobs, more than the total 261 job decline overall. These losses were partially offset by impressive gains elsewhere: Construction employment grew 43.6%, Other Services grew 44.1%, Manufacturing grew 20.8%, and Health Care & Social Assistance grew 17.8%.
Despite strong employment gains in many sectors, the persistent decline in three key industries continues to suppress American Indian workforce participation well after the pandemic.
Northwest Minnesota's workforce diversity trend has not only continued – it has intensified. The pandemic recovery was so heavily driven by workers of color that BIPOC racial and ethnic groups generated all net employment gains in the region, while White Alone employment declined.
Three key forces are shaping this transformation:
For workforce development professionals, these trends demand strategic attention to recruitment, retention, and training programs that reflect the region's evolving demographics. The workers powering Northwest Minnesota's present and future look different than the workforce of the past.
For more information about job growth in Northwest Minnesota, contact Anthony Schaffhauser at Anthony.schaffhauser@state.mn.us.
