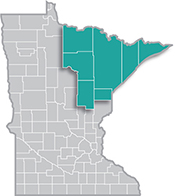
 Home to the state's second-largest metro, the Northeast Region has a strong industrial sector, tied largely to the area's abundant natural resources.
Most of the manufacturing base centers on mining and forest products industries. More than half of the sector's employment is in paper and machinery manufacturing.
Want the freshest data delivered by email? Subscribe to our regional newsletters.
The third quarter is typically the peak season in Northeast Minnesota for employment levels.
7/23/2025 11:08:05 AM
Carson Gorecki
The third quarter (covering the months of July, August and September) is typically the peak season in Northeast Minnesota for employment levels. The summer months, and the weather that comes with them, represent an increase in business opportunity for many industries. My blog from the end of last year highlighted seasonal employment variation by industry. The top spot belonged to Crop Production, which typically peaks in the second quarter, which is the planting season. However, most of the industries with the highest seasonal variation in Northeast Minnesota peak a little later in the year, in third quarter.
Fifteen of the 25 most seasonally variable industries typically saw their payrolls top out in the third quarter (see Table 1). You may now choose to refer to the members of this list as the “industries of the summer.” Overall, 47 of the 113 ranked industries in the region typically experience third quarter employment peaks. Conversely, only 17 had typical employment lows in the third quarter.
| Table 1. Northeast Minnesota Industries with Peak Employment in the Summer | |||||
|---|---|---|---|---|---|
| Seasonality Ranking (2019-2023) | Industry | Qtr. 3 Employment (2024) | Annual Average Employ-ment (2024) | Coefficient of Variation (2024) | Qtr. 3 Avg. Wage (2024) |
| N/A | Total, All Industries | 142,381 | 140,456 | 1.66 | $59,540 |
| 2 | Motion Picture and Sound Recording Industries | 138 | 143 | 7.23 | $17,732 |
| 3 | Rental and Leasing Services | 353 | 268 | 27.25 | $39,572 |
| 4 | Heavy and Civil Engineering Construction | 1,947 | 1,567 | 21.42 | $109,876 |
| 7 | Water Transportation | 214 | 197 | 13.53 | $133,484 |
| 8 | Accommodation | 3,906 | 3,262 | 15.54 | $29,328 |
| 9 | Performing Arts, Spectator Sports, and Related Industries | 420 | 399 | 5.50 | $19,604 |
| 10 | Museums, Historical Sites, and Similar Institution | 468 | 399 | 15.64 | $28,964 |
| 11 | Fishing, Hunting and Trapping | 31 | 25 | 23.55 | $55,172 |
| 14 | Construction | 8,435 | 7,446 | 13.03 | $82,940 |
| 15 | Specialty Trade Contractors | 4,349 | 3,891 | 11.72 | $76,388 |
| 16 | Animal Production and Aquaculture | 22 | 22 | 13.06 | $21,840 |
| 17 | Arts, Entertainment, and Recreation | 4,039 | 3,622 | 9.15 | $31,044 |
| 19 | Amusement, Gambling, and Recreation Industries | 3,150 | 2,823 | 9.37 | $32,916 |
| 21 | Accommodation and Food Services | 15,571 | 14,354 | 7.19 | $24,700 |
| 25 | Food Services and Drinking Places | 11,665 | 11,092 | 4.80 | $23,140 |
| Source: DEED Quarterly Census of Employment and Wages | |||||
Many industries with relatively higher summer employment belong to the Construction or Leisure & Hospitality sectors, underlining the important role that weather plays in facilitating “the busy season” for those industries. Typically, the relatively small Motion Picture & Sound Recording Industries, which had the second-highest seasonal employment variation from 2019-2023, peaks during the summer. However, in 2024 it actually bucked the historical trend and had a 2024 employment peak in first quarter, likely because they filmed a Christmas movie in the winter. Industries with smaller headcounts are more likely to see year-to-year seasonal employment fluctuations, in addition to the in-year seasonal variation.
Rental & Leasing Services, which is not technically in Leisure & Hospitality, nevertheless benefits as demand for rental cars and recreational equipment rises. The Water Transportation industry is similar and depends largely on the availability of the unfrozen variety of the big lake.
More directly tied to tourism in the region are Accommodation, Performing Arts, Spectator Sports & Related Industries, and Museums, Historical Sites & Similar Institutions. These industries and others like Amusement, Gambling & Recreation Industries and Food Services & Drinking Places play important roles in Northeast Minnesota’s well-documented tourism-oriented economy. According to Explore Minnesota, over 1.2 billion dollars were spent in the region by visitors.
As Minnesotans know, vacation season is also road construction season. This shows up in the employment data with Heavy & Civil Engineering Construction toward the top of the seasonality list. While certainly an inconvenience to all of us trying to get some place in the summer months, many of these construction jobs pay well above the regional average and bring additional economic activity to the region. The presence of Specialty Trade Contractors in the list is reflective of increased construction of buildings and home renovations.
Finally, to take advantage of the longer days, many of these industries see significant increases in hours worked in third quarter as well, increasing the earning potential for many of the workers willing and able to take advantage. Table 2 shows the industries in Northeast Minnesota with the highest hours worked differential in third quarter compared to the annual quarterly average from 2023. Half of the top 20 are either in the top employment seasonality list as well or like Air Transportation, are closely connected to the Leisure & Hospitality sector in some way.
| Table 2. Median Quarterly Hours Worked for Select Industries in Northeast Minnesota, 2023 | |||
|---|---|---|---|
| Industry | Qtr. 3 Median Hours Worked | Annual Quarterly Average | Qtr. 3 Percent Above Annual Median |
| Total, All Industries | 392 | 392 | +0% |
| Air Transportation | 229 | 137 | +67% |
| Rental & Leasing Services | 347 | 240 | +45% |
| Amusement, Gambling & Recreation Industries | 259 | 188 | +38% |
| Agriculture & Forestry Support Activity | 332 | 255 | +30% |
| Motion Picture & Sound Recording Industries | 182 | 142 | +28% |
| Miscellaneous Manufacturing | 273 | 223 | +22% |
| Plastics & Rubber Products Manufacturing | 548 | 482 | +14% |
| Other Information Services | 543 | 480 | +13% |
| Museums, Parks & Historical Sites | 262 | 234 | +12% |
| Food Services & Drinking Places | 180 | 161 | +12% |
| Pipeline Transportation | 560 | 503 | +11% |
| Broadcasting & Content Providers | 416 | 374 | +11% |
| Telecommunications | 560 | 505 | +11% |
| Electrical Equipment & Appliances Mfg. | 532 | 480 | +11% |
| Transportation Equipment Manufacturing | 560 | 509 | +10% |
| Specialty Trade Contractors | 449 | 410 | +10% |
| Administrative & Support Services | 268 | 245 | +9% |
| Accommodation | 239 | 219 | +9% |
| Heavy & Civil Engineering Construction | 521 | 480 | +9% |
| Couriers & Messengers | 300 | 277 | +8% |
| Source: DEED Quarterly Employment Demographics | |||
Whether you are measuring impact by employment, wages or hours, the summer is the season for many industries in Northeast Minnesota. These industries are crucial to our regional economy. So next time your trip to the cabin or campground is delayed by construction, take some solace in the local economic impact.
For more information about employment trends in Northeast Minnesota, contact Carson Gorecki at carson.gorecki@state.mn.us.
