 The Minneapolis-St. Paul metropolitan area is a national leader in finance, advanced manufacturing, agriculture and retailing.
Medical devices, electronics and processed foods are strong suits recognized globally.
Want the freshest data delivered by email? Subscribe to our regional newsletters.
12/23/2024 1:56:47 PM
Tim O'Neill
Recently, DEED released employment projections for the state of Minnesota and its six planning regions. This data is compiled by both occupation and industry, and can be utilized by educational institutions, businesses, employment counselors, career seekers and more to make informed planning decisions. According to this data, employment in the Seven-County Metro Area is projected to grow by 4.9% between 2022 and 2032. This is equivalent to approximately 95,000 net new jobs in the region during that period. Slightly outpacing the statewide growth rate of 4.6%, the Metro Area is anticipated to account for nearly two-thirds (65.6%) of Minnesota's net new jobs over the next decade.
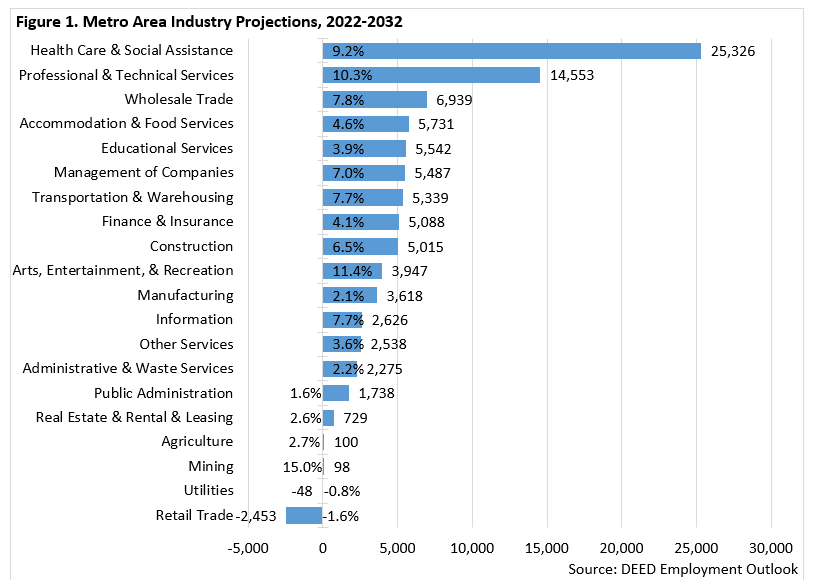
Leading the charge for new employment growth is Health Care & Social Assistance. Between 2022 and 2032, this major industry is anticipated to gain over 25,300 net new jobs, growing by 9.2%. Zooming in, net new growth in this industry will be led by Social Assistance (+11,600 jobs; +15.4%) and Ambulatory Health Care Services (+8,900 jobs; +9.9%). Employment in Hospitals (+3,500 jobs; +5.8%) is anticipated to grow just above the growth rate for the total of all industries, while employment in Nursing & Residential Care Facilities (+1,300 jobs; +2.7%) will be slightly slower.
Other major industries projected to add a significant number of new jobs over the coming decade in the Metro Area include Professional & Technical Services (+14,500 jobs; +10.3%); Wholesale Trade (+6,900 jobs; +7.8%); Accommodation & Food Services (+5,700 jobs; +4.6%); Educational Services (+5,500 jobs; +3.9%); Management of Companies (+5,500 jobs; +7.0%); Transportation & Warehousing (+5,400 jobs; +7.7%); Finance & Insurance (+5,100 jobs; +4.1%); and Construction (+5,000 jobs; +6.5%) (Figure 1).

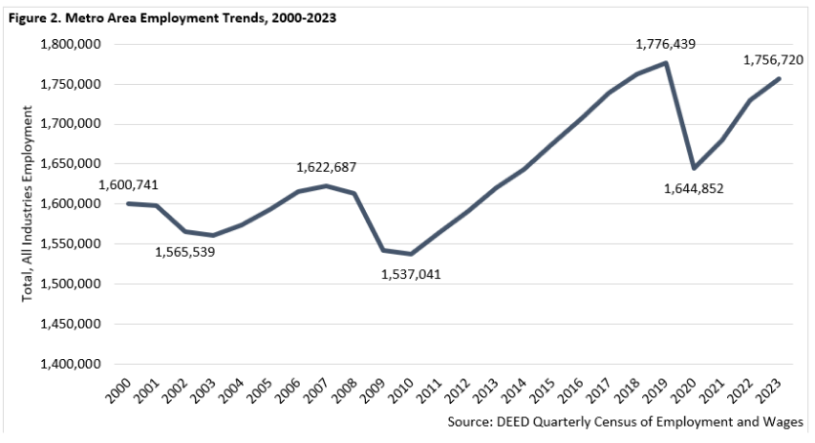
It should be noted that the reliability of projections is subject to error due to the assumptions of the methodology used. Many factors can and will affect the economy and employment levels over the 10-year projections period. For example, the Metro Area's total employment increased by 1.6% (+25,439 jobs) between 2002 and 2012. This period, of course, included the Great Recession, where employment in the region plummeted by more than 85,600 jobs between 2007 and 2010. Fast forwarding, the region's total employment increased by 8.7% (+139,173 jobs) between 2012 and 2022. This period included the COVID-19 pandemic, where total employment would whiplash down and then back up by more than 110,000 jobs over the course of four years (Figure 2). To account for such unanticipated changes, DEED's Employment Outlook tool is updated every other year.

As previously mentioned, Social Assistance and Ambulatory Health Care Services are anticipated to grow significantly over the coming decade. Along with those major industries at the 2-digit NAICS level, DEED's Employment Outlook tool allows users to view those industries at the 3-digit and 4-digit NAICS levels. This level of analysis can provide for a more complete understanding of how the labor market and economy is expected to grow and change over the coming decade. Table 1 includes those 3-digit NAICS industries anticipated to gain 1,000 or more net new jobs between 2022 and 2032. These in-depth industries can be found in everything from Health Care & Social Assistance and Professional & Technical Services to Construction and Manufacturing.
| Table 1. Metro Area Employment Projections for In-Depth Industries, 2022-2032 | ||||
|---|---|---|---|---|
| Industry Sector | 2022 Estimated Employment | 2032 Projected Employment | Percent Change | Total Change |
| Professional & Technical Services | 141,207 | 155,760 | +10.3% | 14,553 |
| Social Assistance | 75,040 | 86,627 | +15.4% | 11,587 |
| Ambulatory Health Care Services | 89,989 | 98,888 | +9.9% | 8,899 |
| Merchant Wholesalers, Durable Goods | 58,071 | 64,614 | +11.3% | 6,543 |
| Educational Services | 140,511 | 146,053 | +3.9% | 5,542 |
| Management of Companies | 78,011 | 83,498 | +7.0% | 5,487 |
| Food Services & Drinking Places | 114,497 | 119,521 | +4.4% | 5,024 |
| Insurance Carriers & Related Activities | 63,443 | 67,066 | +5.7% | 3,623 |
| Hospitals | 60,185 | 63,685 | +5.8% | 3,500 |
| Specialty Trade Contractors | 51,543 | 54,558 | +5.8% | 3,015 |
| Amusement, Gambling & Recreation Industries | 22,410 | 24,689 | +10.2% | 2,279 |
| Warehousing and Storage | 14,256 | 16,271 | +14.1% | 2,015 |
| Miscellaneous Manufacturing | 21,899 | 23,870 | +9.0% | 1,971 |
| Administrative & Support Services | 99,704 | 101,613 | +1.9% | 1,909 |
| Performing Arts & Spectator Sports | 10,515 | 12,070 | +14.8% | 1,555 |
| Personal & Laundry Services | 18,914 | 20,395 | +7.8% | 1,481 |
| Nursing & Residential Care Facilities | 49,015 | 50,355 | +2.7% | 1,340 |
| Publishing Industries | 16,500 | 17,824 | +8.0% | 1,324 |
| Construction of Buildings | 18,282 | 19,577 | +7.1% | 1,295 |
| Couriers and Messengers | 11,906 | 13,164 | +10.6% | 1,258 |
| Computer & Electronic Product Manufacturing | 35,017 | 36,140 | +3.2% | 1,123 |
| ISPs, Search Portals, & Data Processing | 6,456 | 7,464 | +15.6% | 1,008 |
| Source: DEED Employment Projections | ||||
Contact Tim O'Neill, Labor Market Analyst, at timothy.oneill@state.mn.us.