 The presence of such industry powerhouses as Polaris, Arctic Cat and New Flyer make Northwest Minnesota a hub of transportation equipment manufacturing.
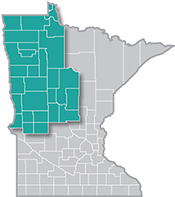
From wheat and potatoes to soybeans and sugar beets, the region is a major producer and processor of food staples and specialty agricultural products.
Want the freshest data delivered by email? Subscribe to our regional newsletters.
4/23/2025 11:40:37 AM
Anthony Schaffhauser, James Whirlwind Soldier
As detailed in a recent article in Minnesota Economic Trends, census data shows that the number of self-employed workers in Northwest Minnesota surged by 5.5% from 2020 to 2022, a gain of more than 2,300 new nonemployer establishments. That was more than three times as many as the number of self-employed workers lost during the Pandemic Recession, when Northwest dropped 754 nonemployers from 2019 to 2020. In 2022, there were now just over 44,600 nonemployer establishments in the 26-county region, which was just over 10% of the state total (Table 1).
| Table 1. Minnesota Nonemployer Statistics by Region, 2022 | ||||||||
|---|---|---|---|---|---|---|---|---|
| Area | Number of Nonemployers | Percent of State Total | Change from 2006-2022 | Change from 2019-2020 | Change from 2020-2022 | |||
| Number | Percent | Number | Percent | Number | Percent | |||
| Central | 52,800 | 11.9% | +3,227 | +6.5% | -166 | -0.3% | +3,339 | +6.8% |
| Northeast | 21,331 | 4.8% | -288 | -1.3% | -981 | -4.8% | +1,871 | +9.6% |
| Northwest | 44,632 | 10.1% | +1,775 | +4.1% | -754 | -1.8% | +2,323 | +5.5% |
| Southeast | 34,378 | 7.8% | +2,566 | +8.1% | -881 | -2.7% | +2,507 | +7.9% |
| Southwest | 27,704 | 6.3% | +450 | +1.7% | -721 | -2.7% | +1,507 | +5.8% |
| Twin Cities | 261,500 | 59.1% | +57,751 | +28.3% | -5,146 | -2.1% | +21,367 | +8.9% |
| Minnesota | 442,345 | 100.0% | +65,481 | +17.4% | -8,649 | -2.1% | +32,914 | +8.0% |
| Source: U.S. Census Bureau, Nonemployer Statistics | ||||||||
In order to be considered as a nonemployer establishment, the business must have no paid employees, have annual business receipts of $1,000 or more and be subject to federal income taxes. This broad definition encompasses a diverse spectrum of self-employment activities, ranging from full-time entrepreneurs who rely on their business as their primary source of income to part-time business owners who treat it as a supplementary income stream alongside a traditional job or other revenue sources.
They include the professionals preparing taxes or creating advertising campaigns for local businesses, the independent truck drivers keeping products moving through supply chains, the skilled tradespeople building and finishing homes and the real estate agents selling them. These solo entrepreneurs represent a small part of the region's total workforce, but they are important to long-term economic health and resilience.
Twenty-four of the 26 counties saw a rebound in the number of self-employed workers from 2020 to 2022, with the fastest increases seen in Todd, Clay, Stevens, Beltrami and Douglas counties all growing 8% or more. Well over half of the counties in the region saw a gain over the past 10 years, with 16 counties adding nonemployers from 2013 to 2022. The largest and fastest gain occurred in Clay County, with just over 4,500 self-employed workers in 2022. With 5,652 nonemployer establishments, Crow Wing County has the largest number, and saw the third fastest growth. Smaller counties like Lake of the Woods, Mahnomen and Todd County and larger counties like Otter Tail and Douglas County also saw rapid growth over the decade. In contrast, Pennington and Grant saw the fastest declines (Table 2).
| Table 2. Nonemployer Statistics by County, 2013-2022 | |||||||
|---|---|---|---|---|---|---|---|
| County | 2013 | 2019 | 2020 | 2022 | 2013-2022 | 2019-2020 | 2020-2022 |
| Becker Co. | 2,834 | 2,904 | 2,859 | 2,959 | +4.4% | -1.5% | +3.5% |
| Beltrami Co. | 2,979 | 2,821 | 2,733 | 2,973 | -0.2% | -3.1% | +8.8% |
| Cass Co. | 2,581 | 2,596 | 2,659 | 2,690 | +4.2% | +2.4% | +1.2% |
| Clay Co. | 3,807 | 4,268 | 4,131 | 4,513 | +18.5% | -3.2% | +9.2% |
| Clearwater Co. | 649 | 623 | 613 | 625 | -3.7% | -1.6% | +2.0% |
| Crow Wing Co. | 4,977 | 5,376 | 5,345 | 5,652 | +13.6% | -0.6% | +5.7% |
| Douglas Co. | 3,312 | 3,455 | 3,352 | 3,617 | +9.2% | -3.0% | +7.9% |
| Grant Co. | 551 | 528 | 492 | 512 | -7.1% | -6.8% | +4.1% |
| Hubbard Co. | 1,698 | 1,737 | 1,680 | 1,755 | +3.4% | -3.3% | +4.5% |
| Kittson Co. | 327 | 334 | 338 | 333 | +1.8% | +1.2% | -1.5% |
| Lake of the Woods Co. | 351 | 379 | 379 | 399 | +13.7% | 0.0% | +5.3% |
| Mahnomen Co. | 303 | 334 | 324 | 340 | +12.2% | -3.0% | +4.9% |
| Marshall Co. | 645 | 605 | 625 | 635 | -1.6% | +3.3% | +1.6% |
| Morrison Co. | 2,366 | 2,304 | 2,305 | 2,416 | +2.1% | 0.0% | +4.8% |
| Norman Co. | 487 | 470 | 476 | 486 | -0.2% | +1.3% | +2.1% |
| Otter Tail Co. | 4,684 | 4,915 | 4,828 | 5,099 | +8.9% | -1.8% | +5.6% |
| Pennington Co. | 893 | 819 | 792 | 829 | -7.2% | -3.3% | +4.7% |
| Polk Co. | 2,183 | 2,154 | 2,068 | 2,166 | -0.8% | -4.0% | +4.7% |
| Pope Co. | 971 | 1,027 | 1,015 | 1,039 | +7.0% | -1.2% | +2.4% |
| Red Lake Co. | 231 | 221 | 216 | 222 | -3.9% | -2.3% | +2.8% |
| Roseau Co. | 1,162 | 1,107 | 1,094 | 1,121 | -3.5% | -1.2% | +2.5% |
| Stevens Co. | 627 | 627 | 592 | 644 | +2.7% | -5.6% | +8.8% |
| Todd Co. | 1,649 | 1,673 | 1,662 | 1,837 | +11.4% | -0.7% | +10.5% |
| Traverse Co. | 261 | 278 | 271 | 281 | +7.7% | -2.5% | +3.7% |
| Wadena Co. | 1,012 | 1,008 | 978 | 1,029 | +1.7% | -3.0% | +5.2% |
| Wilkin Co. | 474 | 500 | 482 | 460 | -3.0% | -3.6% | -4.6% |
| Northwest | 42,014 | 43,063 | 42,309 | 44,632 | +6.2% | -1.8% | +5.5% |
| Source: U.S. Census Bureau Nonemployer Statistics | |||||||
Additional detail on each county's nonemployer establishments can be found in the interactive visualization at the bottom of the article. For example, data for each county includes a breakdown by industry, changes over different years, and a map showing Location Quotients.
Contact Anthony Schaffhauser at Anthony.schaffhauser@state.mn.us.
