 The presence of such industry powerhouses as Polaris, Arctic Cat and New Flyer make Northwest Minnesota a hub of transportation equipment manufacturing.
From wheat and potatoes to soybeans and sugar beets, the region is a major producer and processor of food staples and specialty agricultural products.
Want the freshest data delivered by email? Subscribe to our regional newsletters.
12/23/2024 2:09:52 PM
Anthony Schaffhauser
My blog from January 2024 showed how caregiving – either childcare or elder care – impacted workforce trends since the pandemic in 2020. This month, I show that caregiving remains a major issue keeping females out of the workforce. I also employ additional data to be more precise about it.
The most current Quarterly Workforce Indicators (QWI) data on workforce demographics is updated through the first quarter of 2024. To create annual averages, I will use the average employment by age and sex for the four quarters from second quarter 2023 to first quarter 2024 and compare to the average employment for same four quarters directly before the start of the pandemic, from the second quarter of 2019 to the first quarter of 2020. To make this blog less cumbersome, I'll simply state the year, for example, 2020 or 2024. However, know that any reference to employment from here on refers to "year-to-first quarter" annual employment averages.
For 2024, as with 2023, female employment remains below pre-pandemic levels, while male employment increased. Specifically, female employment dropped by 1,261 jobs (-1.1%) from 2020 to 2024, while male employment increased 3,317 (+3.1%). While this is a healthy gain in female employment compared to the drop of 5,249 (-4.4%) from 2020 to 2023, data shows that males also had notable employment gains of 317 jobs (+0.3%) from 2020 to 2023. Thus, the gap between female and male employment change narrowed by 989, but is still a significant 4,577 jobs.
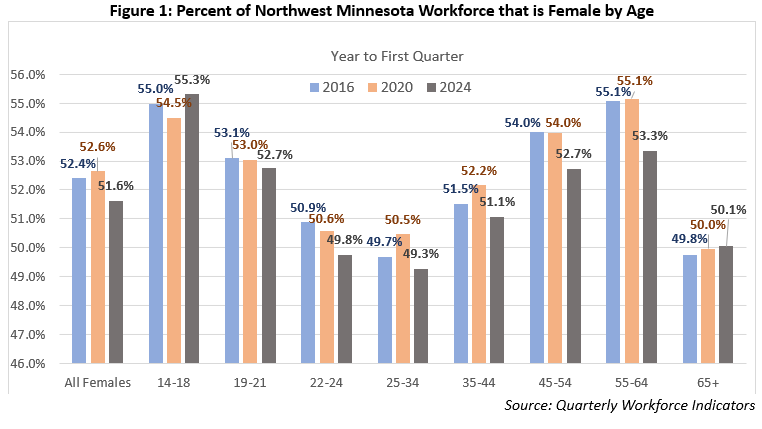
Figure 1 illustrates the workforce impact by showing the percent of the workforce by age that is female in 2016, 2020, and 2024. Note that we don't need to show males because it is just the balance of the percentage. For example, 51.6% females in 2024 means the remainder is 48.4% males. Note also that these data do not include self-employment, which is more common for males.

As with 2023, the declines remain concentrated in the 25-to-64-year age groups. Every age group in this range went from increasing or flat from 2016 to 2020 to a decline in 2024. In contrast, female jobholders from age 14 to 18 and 65 years and over increased in 2024. However, the age 65 and over increase is a continuation of the 2016 to 2020 trend, while the age 14 to 18 reversed the trend.
Age 19 to 21 went from nearly flat to a decline in 2024, but the change was not all from females not participating in the workforce. Instead, the population of females did not grow as much as males from 2020 to 2024. The population of males aged 19 to 21 grew by 409, while females grew by 282, a difference of 127. The population of males aged 22 to 24 grew by 226 more than females, and males aged 45 to 54 grew 242 more. Overall, the male population aged 14 and over grew 560 more than females. So, while Figure 1 nicely illustrates the impact, it is also somewhat exaggerating it. To isolate the workforce change from population change, I'll divide employment by population to yield an employment to population ratio.
Specifically, I divide the jobs held by females and males by the population for each age group. This QWI employment is derived from Unemployment Insurance records matched to Census demographics, so it only includes jobs covered by Unemployment Insurance and as mentioned above, self-employment is not counted. Also, employment is based on where the job is. This differs from the employment-to-population ratio published by the Bureau of Labor Statistics for states, which is based on a survey. Respondents provide their employment status, and the self-employed as well as those working in a different state than where they live are included in the BLS employment estimates. To distinguish my ratio, I call it "Covered Employment to Resident Population (CERP)." The important thing is that it controls for population changes.
Table 1 has CERP by age and sex for Northwest Minnesota, providing a more precise assessment of the workforce impact. For all ages 14 and over, the female CERP ratio declined from 50.8% of the resident population working in 2020 to 49.3% in 2024, or -1.6%. Male CERP increased 0.4% over this time. This analysis clearly shows a decline in female workforce participation concentrated in the 22-to-64-year age groups. While age 19 to 21 CERP declined for females, it is only 0.3 percentage points more than the decline for males. CERP for age 22 to 24 also declined for both sexes, but by a more significant 0.8 percentage points more for females. CERP for the other age groups included in ages 25 to 64 declined for females while increasing for males, with a difference of between 2.7 percentage points and 3.8 percentage points.
| Table 1: Change in Covered Employment to Resident Population Ratio (CERP) by Age and Sex | ||||||||
|---|---|---|---|---|---|---|---|---|
| Age | Sex | Year to First Quarter (Yt1Q) 2020 Jobs* | 2020 Resident Population** | Yt1Q 2020 CERP* | Yt1Q 2024 Jobs* | 2023 Resident Population** | Yt1Q 2024 CERP* | CERP Change Yt1Q 2020 to Yt1Q 2024* |
| 14 to 18 | Female | 5,533 | 18,093 | 30.6% | 7,077 | 19,129 | 37.0% | 6.4% |
| Male | 4,619 | 19,310 | 23.9% | 5,721 | 20,394 | 28.1% | 4.1% | |
| 19 to 21 | Female | 6,560 | 10,647 | 61.6% | 6,517 | 10,929 | 59.6% | -2.0% |
| Male | 5,807 | 10,656 | 54.5% | 5,837 | 11,065 | 52.8% | -1.7% | |
| 22 to 24 | Female | 6,243 | 9,418 | 66.3% | 5,918 | 9,352 | 63.3% | -3.0% |
| Male | 6,097 | 9,890 | 61.7% | 5,973 | 10,050 | 59.4% | -2.2% | |
| 25 to 34 | Female | 21,998 | 30,064 | 73.2% | 20,667 | 29,661 | 69.7% | -3.5% |
| Male | 21,591 | 32,170 | 67.1% | 21,285 | 31,696 | 67.2% | 0.0% | |
| 35 to 44 | Female | 23,821 | 32,189 | 74.0% | 24,448 | 33,741 | 72.5% | -1.5% |
| Male | 21,848 | 34,504 | 63.3% | 23,423 | 35,960 | 65.1% | 1.8% | |
| 45 to 54 | Female | 22,314 | 30,021 | 74.3% | 21,854 | 29,789 | 73.4% | -1.0% |
| Male | 19,033 | 31,874 | 59.7% | 19,599 | 31,884 | 61.5% | 1.8% | |
| 55 to 64 | Female | 24,019 | 41,574 | 57.8% | 21,542 | 39,073 | 55.1% | -2.6% |
| Male | 19,534 | 42,376 | 46.1% | 18,839 | 39,865 | 47.3% | 1.2% | |
| 65 and over | Female | 8,409 | 61,851 | 13.6% | 9,612 | 67,027 | 14.3% | 0.7% |
| Male | 8,421 | 57,247 | 14.7% | 9,589 | 62,517 | 15.3% | 0.6% | |
| Total 14 and over | Female | 118,895 | 233,857 | 50.8% | 117,634 | 238,701 | 49.3% | -1.6% |
| Male | 106,949 | 238,027 | 44.9% | 110,266 | 243,431 | 45.3% | 0.4% | |
|
*Based on average employment for the four quarters to the beginning of first quarter of 2020 (Yt1Q 2020) and Yr1Q 2023. **Population estimates used are for April 2020 and July 2023. Source: Quarterly Workforce Indicators (QWI), U.S. Census Bureau Population Estimates, and author's calculations. |
||||||||
This data again shows that the lack of affordable childcare and eldercare has a continuing workforce impact in Northwest Minnesota. As I stated in a comprehensive article covering Minnesota's labor force dynamics, "Caregiving is the plausible explanation for the lower rate of females in the workforce." These are the ages where people, particularly females, are most likely to be caring for children, grandchildren, and elderly parents. This pulls them out of the workforce. Strategies to increase workforce participation in the region will need to address these issues, among others.
Contact Anthony Schaffhauser at Anthony.schaffhauser@state.mn.us.