 The Minneapolis-St. Paul metropolitan area is a national leader in finance, advanced manufacturing, agriculture and retailing.
Medical devices, electronics and processed foods are strong suits recognized globally.
Want the freshest data delivered by email? Subscribe to our regional newsletters.
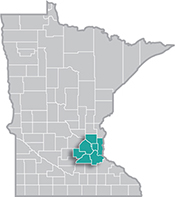
The Seven-County Twin Cities Metro Area has a diverse workforce and it is diversifying even more with time.
8/27/2025 11:49:31 AM
Tim O'Neill
The Seven-County Twin Cities Metro Area has a diverse workforce and it is diversifying even more with time. According to the Census Bureau's Quarterly Workforce Indicators (QWI) program, the Metro Area had over 1.8 million jobs in 2024. Of these total jobs, more than one-fifth (21.6%) were held by persons reporting as a race other than white. Additionally, 6.6% of the region's total jobs were held by persons reporting Hispanic or Latino origins. Comparatively, 16.9% of Minnesota's total jobs were held by persons reporting as a race other than white while 6.3% were held by persons reporting Hispanic or Latino origins. Zooming in, 10.1% of the Metro Area's jobs were held by Black or African Americans, 8.2% were held by Asian or other Pacific Islanders, 2.6% were held by persons reporting Two or More Races, and 0.8% were held by American Indian or Alaska Natives (Figure 1).

Recent trends reveal that the Metro Area's workforce is becoming more racially and ethnically diverse. Over the past five years, between 2019 and 2024, the total number of jobs held by persons reporting as a race other than white increased by 11.6%. This was equivalent to approximately 40,750 jobs. Zooming in once more reveals the most rapid growth for those reporting Two or More Races (+18.2%; +7,218 jobs). The most significant growth was for those reporting as Black or African American (+19,121 jobs; +11.7%). Growth during this period was also significant for those reporting Hispanic or Latino origin (+24.0%; +23,101 jobs). Meanwhile, the number of jobs held by those reporting as white decreased by 2.3% between 2019 and 2024. This was equivalent to approximately 33,377 less jobs (Table 1).
| Table 1. Metro Area Employment by Race & Ethnicity, 2019-2024 | |||
|---|---|---|---|
| Population | 2024 Employment | 2019 – 2024 Employment Change | |
| Numeric | Percent | ||
| Total | 1,812,879 | +7,373 | +0.4% |
| White | 1,421,848 | -33,377 | -2.3% |
| Black or African American | 182,316 | +19,121 | +11.7% |
| American Indian or Alaska Native | 14,036 | +1,405 | +11.1% |
| Asian or other Pacific Islander | 147,883 | +13,005 | +9.6% |
| Two or More Races | 46,795 | +7,218 | +18.2% |
| Hispanic or Latino (of any race) | 119,389 | +23,101 | +24.0% |
| Source: Quarterly Workforce Indicators | |||
Data from the Census Bureau's QWI also allows us to analyze employment data by industry sectors. Reviewing this data can provide for a greater understanding of how the Metro Area's labor market is shifting. In this case, which industries have higher shares of workers reporting as a race other than white? Which industries have higher shares of workers reporting Hispanic or Latino origins? And which industries are becoming more diverse by race and ethnicity with time?
As of 2024, Health Care & Social Assistance had the Metro Area's highest share of jobs held by persons reporting as a race other than white (36.5%). Manufacturing (25.6%) and Transportation & Warehousing (25.5%) also had high shares of their respective jobs held by workers reporting as a race other than white. Industries with lower shares of employment held by a race other than white included Construction (8.2%); Agriculture, Forestry, Fishing & Hunting (9.8%); and Wholesale Trade (12.6%). Meanwhile, Industries with higher shares of Hispanic or Latino employment included Agriculture, Forestry, Fishing & Hunting (16.5%); Accommodation & Food Services (13.5%); and Administrative & Support Services (12.8%).

Table 2 reveals that nearly all industries are becoming more racially and ethnically diverse with time.
| Table 2. Metro Area Industry Employment Change by Race & Ethnicity, 2019-2024 | ||||
|---|---|---|---|---|
| Industry | Total Employment | White | Race other than White | Hispanic or Latino (of any race) |
| Total, All Industries | 7,373 (0.4%) | -33,377 (-2.3%) | 40,750 (11.6%) | 23,101 (24.0%) |
| Health Care & Social Assistance | 25,146 (9.0%) | 2,674 (1.4%) | 22,472 (25.2%) | 4,056 (34.6%) |
| Manufacturing | -4,578 (-2.6%) | -9,266 (-6.7%) | 4,688 (11.9%) | 3,056 (29.4%) |
| Retail Trade | -4,128 (-2.7%) | -6,671 (-5.3%) | 2,543 (9.0%) | 2,961 (32.0%) |
| Educational Services | -2,782 (-1.8%) | -6,133 (-4.7%) | 3,351 (14.4%) | 1,759 (30.8%) |
| Professional, Sci., & Technical Services | 9,043 (6.6%) | 7,995 (6.8%) | 1,048 (5.2%) | 1,478 (38.8%) |
| Accommodation & Food Services | -7,152 (-5.2%) | -5,019 (-4.8%) | -2,133 (-6.4%) | 1,368 (8.2%) |
| Finance & Insurance | -9,354 (-8.2%) | -9,694 (-9.9%) | 340 (2.1%) | 166 (4.8%) |
| Administrative & Support Services | -11,555 (-11.1%) | -5,813 (-7.6%) | -5,742 (-20.3%) | 661 (5.9%) |
| Construction | 6,987 (8.4%) | 5,376 (6.9%) | 1,611 (27.7%) | 1,750 (40.9%) |
| Wholesale Trade | 2,541 (2.9%) | 296 (0.4%) | 2,245 (24.9%) | 1,198 (34.0%) |
| Management of Companies | -9,674 (-10.7%) | -10,499 (-13.5%) | 825 (6.7%) | 459 (14.4%) |
| Public Administration | 7,812 (11.9%) | 4,554 (8.1%) | 3,258 (33.2%) | 981 (45.9%) |
| Other Services | 378 (0.6%) | -1,254 (-2.5%) | 1,632 (15.1%) | 842 (25.9%) |
| Transportation & Warehousing | 4,633 (9.6%) | 1,576 (4.2%) | 3,057 (29.1%) | n/a |
| Arts, Entertainment, & Recreation | 314 (0.8%) | -224 (-0.6%) | 538 (10.0%) | 422 (20.2%) |
| Information | -701 (-2.0%) | -1,049 (-3.5%) | 348 (7.9%) | 230 (22.3%) |
| Real Estate & Rental & Leasing | -1,049 (-3.8%) | -1,480 (-6.3%) | 431 (11.9%) | 403 (28.3%) |
| Agriculture, Forestry, Fishing & Hunting | 723 (22.6%) | 665 (23.1%) | 58 (17.6%) | n/a |
| Source: Quarterly Workforce Indicators | ||||
To discover more about shifting employment in the Metro Area, contact Tim O'Neill, Labor Market Analyst, at Timothy.ONeill@state.mn.us.
