 The Minneapolis-St. Paul metropolitan area is a national leader in finance, advanced manufacturing, agriculture and retailing.
Medical devices, electronics and processed foods are strong suits recognized globally.
Want the freshest data delivered by email? Subscribe to our regional newsletters.
4/23/2025 11:49:31 AM
Tim O'Neill
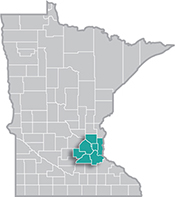
 This month let's take a closer look at population numbers in the Metro Area. According to the U.S. Census Bureau's American Community Survey (ACS) 5-year estimates, the Seven-County Metro Area had a total population of 3,156,517 people in 2023. As such, the Metro Area accounts for over half (55.2%) of Minnesota's total population of 5,713,716 people.
Hennepin County, with a population of 1,268,903 people, is the Metro Area and the state's most populated county. Alone, just over two-fifths of the region's population call Hennepin County home. In addition, nearly one-fifth, or 544,438 people, call Ramsey County home. Together, well over half (57.4%) of the Metro Area's total population reside within Hennepin and Ramsey counties (Table 1).
| Table 1. Metro Area Population Statistics, 2023 | |||||||
|---|---|---|---|---|---|---|---|
| Area | Total Population | 0 to 14 Years | 15 to 24 Years | 25 to 54 Years | 55 to 64 Years | 65+ Years | 16+ Years |
| Hennepin County | 1,268,903 | 230,356
(18.2%) |
152,376
(12.0%) |
537,821
(42.4%) |
156,538
(12.3%) |
191,812
(15.1%) |
1,023,400
(80.7%) |
| Ramsey County | 544,438 | 105,837
(19.4%) |
71,676
(13.2%) |
219,263
(40.3%) |
63,941
(11.7%) |
83,721
(15.4%) |
431,875
(79.3%) |
| Dakota County | 442,204 | 87,869
(19.9%) |
53,206
(12.0%) |
174,339
(39.4%) |
58,875
(13.3%) |
67,915
(13.3%) |
347,168
(78.5%) |
| Anoka County | 367,095 | 71,763
(19.5%) |
43,758
(11.9%) |
145,788
(39.7%) |
50,785
(13.8%) |
55,001
(13.8%) |
290,202
(79.1%) |
| Washington County | 272,298 | 53,616
(19.7%) |
33,297
(12.2%) |
103,972
(38.2%) |
37,434
(13.7%) |
43,979
(16.2%) |
214,557
(78.8%) |
| Scott County | 152,957 | 32,807
(21.4%) |
19,970
(13.1%) |
62,171
(40.6%) |
19,202
(12.6%) |
18,807
(12.3%) |
117,738
(77.0%) |
| Carver County | 108,622 | 22,885
(21.1%) |
13,559
(12.5%) |
42,485
(39.1%) |
14,703
(13.5%) |
14,990
(13.8%) |
84,086
(77.4%) |
| Metro Area | 3,156,517 | 605,133
(19.2%) |
387,842
(12.3%) |
1,285,839
(40.7%) |
401,478
(12.7%) |
476,225
(15.1%) |
2,509,026
(79.5%) |
| Minnesota | 5,713,716 | 1,086,274
(19.0%) |
729,852
(12.8%) |
2,184,904
(38.2%) |
750,543
(13.1%) |
962,143
(16.8%) |
4,549,661
(79.6%) |
| Source: U.S. Census Bureau, American Community Survey 5-Year Estimates | |||||||
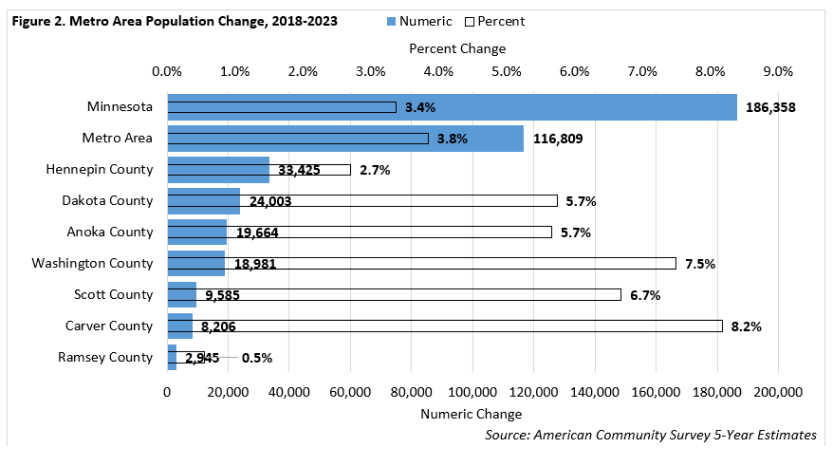
Between the ACS's 2018 and 2023 5-year estimates, an additional 116,809 people now live in the Metro Area. This growth rate of 3.8% slightly outpaced the statewide growth rate of 3.4% during that period, with Greater Minnesota's growth rate at 2.8%. Put another way, the Metro Area accounted for 62.7% of Minnesota's population growth between 2018 and 2023.
Once again, Hennepin County makes the top of the list, adding the most people during this period (+33,425; +2.7%). Following this growth are three other Metro Area counties: Dakota County (+24,003; +5.7%); Anoka County (+19,664; +5.7%); and Washington County (+18,981; +7.5%). Following Wright County (+12,525; +9.4%) and Olmsted County (+10,360; +6.8%) are two more Metro Area counties: Scott County (+9,585; +6.7%) and Carver County (+8,206; +8.2%). Of Minnesota's top ten growing counties between 2018 and 2023, six are in the Metro Area. Ramsey County (+2,945; +0.5%) grew much slower than its regional neighbors, but still managed to place 13th for largest population growth in the state. Overall, 62 of Minnesota's 87 counties grew in population between 2018 and 2023.
In terms of population growth rates, Wright County led Minnesota's 87 counties with a growth rate of 9.4% between 2018 and 2023. Carver County, with a growth rate of 8.2% wasn't far off that mark, with Isanti County (+7.6%), Washington County (+7.5%), Olmsted County (+6.8%), Scott County (+6.7%), Sherburne County (+6.4%), Cook County (+6.1%), and Douglas County (+5.8%) rounding out the top nine spots. Cass County, Dakota County, and Anoka County tied for the tenth spot, each achieving population growth rates of 5.7% between 2018 and 2023. See Figure 2 for population growth in the Metro Area.

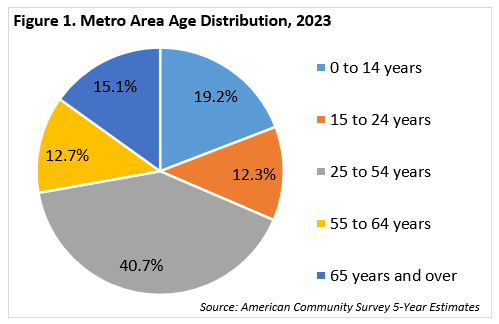
In addition to total population size in 2023, Table 1 breaks down Minnesota's, the Metro Area's, and each county's population by age cohorts. You can see, for example, that the prime-working age cohort (those between 25 and 54 years of age) constitutes two-fifths of the Metro Area's total population. This population is the cohort that typically has the highest labor force participation rates. Table 2 reveals that this population cohort is growing slightly slower than the total population in the region (+1.8% versus +3.8%) between 2018 and 2023. At the same time, the region's population being 65 years of age and older grew at a rate five times faster than the total population. Employers, economic developers, educators, and others should continue to keep an eye on population trends to best prepare for the future.
| Table 2. Metro Area Population Change by Age, 2018 – 2023 | ||||||
|---|---|---|---|---|---|---|
| Area | Total Population | 0 to 14 years | 15 to 24 years | 25 to 54 years | 55 to 64 years | 65 years and over |
| Anoka County | +19,664
(+5.7%) |
+2,641
(+3.8%) |
+1,395
(+3.3%) |
+2,434
(+1.7%) |
+3,443
(+7.3%) |
+9,751
(+21.5%) |
| Carver County | +8,206
(+8.2%) |
+388
(+1.7%) |
+623
(+4.8%) |
+1,323
(+3.2%) |
+1,844
(+14.3%) |
+4,028
(+36.7%) |
| Dakota County | +24,003
(+5.7%) |
+2,310
(+2.7%) |
+1,991
(+3.9%) |
+3,752
(+2.2%) |
+2,881
(+5.1%) |
+13,069
(+23.8%) |
| Hennepin County | +33,425
(+2.7%) |
-372
(-0.2%) |
+2,304
(+1.5%) |
+3,634
(+0.7%) |
+207
(+0.1%) |
+27,652
(+16.8%) |
| Ramsey County | +2,945
(+0.5%) |
-1,125
(-1.1%) |
-3,272
(-4.4%) |
+622
(+0.3%) |
-2,753
(-4.1%) |
+9,473
(+12.8%) |
| Scott County | +9,585
(+6.7%) |
-689
(-2.1%) |
+2,026
(+11.3%) |
+967
(+1.6%) |
+2,780
(+16.9%) |
+4,501
(+31.5%) |
| Washington County | +18,981
(+7.5%) |
+2,080
(+4.0%) |
+1,629
(+5.1%) |
+3,795
(+3.8%) |
+2,481
(+7.1%) |
+8,996
(+25.7%) |
| Metro Area | +116,809
(+3.8%) |
+5,233
(+0.9%) |
+6,696
(+1.8%) |
+16,527
(+1.3%) |
+10,883
(+2.8%) |
+77,470
(+19.4%) |
| Minnesota | +186,358
(+3.4%) |
+9,110
(+0.8%) |
+11,420
(+1.6%) |
+20,678
(+1.0%) |
+13,119
(+1.8%) |
+132,031
(+15.9%) |
| Source: American Community Survey 5-Year Estimates | ||||||
Contact Tim O'Neill, Labor Market Analyst, at timothy.oneill@state.mn.us