 The Minneapolis-St. Paul metropolitan area is a national leader in finance, advanced manufacturing, agriculture and retailing.
Medical devices, electronics and processed foods are strong suits recognized globally.
Want the freshest data delivered by email? Subscribe to our regional newsletters.
1/30/2025 1:56:47 PM
Tim O'Neill
It's time to light up the new year with some fresh energy. Let's take an up-close look at Electric Power Generation in the Twin Cities Metro Area. According to the Census Bureau's North American Industry Classification System (NAICS), Electric Power Generation comprises establishments primarily engaged in - you guessed it - operating electric power generation facilities. These facilities, and subsequent in-depth NAICS industries, can be broken down by various forms of energy: hydroelectric, fossil fuels, nuclear, solar electric, wind electric, geothermal, biomass, and other electric power generation. Whether by sunlight, the wind, the burning of natural gas or oil, or the splitting of the atom, electric power generation has one major goal: producing electric energy and providing electricity to homes and businesses.
In the Twin Cities Metro Area, there were 40 Electric Power Generation establishments supplying just over 1,200 covered jobs in 2023. Total payroll for this industry equaled $146.4 million in 2023, with the average annual wage equal to $120,328. This average wage was considerably higher than the average annual wage for the total of all industries, which was $78,312 (Table 1).
| Table 1. Electric Power Generation Industry Statistics, 2023 | ||||
|---|---|---|---|---|
| Industry | Number of Establishments | Number of Jobs | Total Payroll ($1,000s) | Avg. Annual Wage |
| Twin Cities Metro Area | ||||
| Total, All Industries | 94,017 | 1,756,720 | $137,543,437 | $78,312 |
| Electric Power Generation | 40 | 1,218 | $146,397 | $120,328 |
| Hydroelectric Power Generation | 14 | 538 | $39,575 | $73,580 |
| Fossil Fuel Electric Power Generation | 4 | 362 | $59,691 | $164,996 |
| Wind Electric Power Generation | 13 | 109 | $18,932 | $174,564 |
| Minnesota | ||||
| Total, All Industries | 208,074 | 2,906,616 | $207,847,572 | $71,500 |
| Electric Power Generation | 159 | 4,798 | $626,405 | $130,624 |
| Hydroelectric Power Generation | 36 | 616 | $53,015 | $86,008 |
| Fossil Fuel Electric Power Generation | 26 | 1,919 | $248,740 | $129,688 |
| Solar Electric Power Generation | 19 | 95 | $15,978 | $169,520 |
| Wind Electric Power Generation | 58 | 343 | $49,646 | $145,340 |
| Other Electric Power Generation | 12 | 218 | $29,487 | $135,668 |
| Source: DEED Quarterly Census of Employment and Wages | ||||
Zooming in, Hydroelectric Power Generation accounted for the most power generation jobs in the Metro Area (538 jobs), followed by Fossil Fuel Electric Power Generation (362 jobs). As such, nearly three-quarters (73.9%) of the region's power generation jobs were within these two sectors. The bulk of remaining power generation jobs were in Biomass Electric Power Generation (140 jobs), Wind Electric Power Generation (109 jobs), and Solar Electric Power Generation (64 jobs).
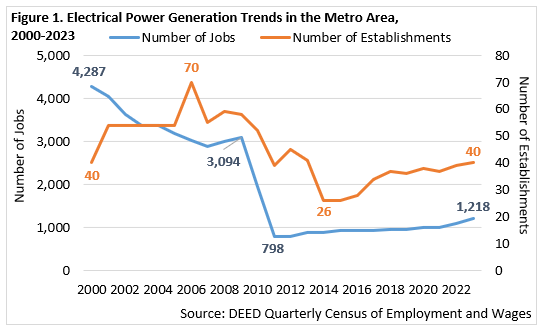
Interestingly, while Electric Power Generation employment in the Metro Area is up from 2011 (+420 jobs; +52.6%), the number of such jobs is down significantly from levels witnessed at the turn of the millennium. More specifically, the industry is down over 70% (-3,069 jobs) between 2000 and 2023. Much of this loss occurred between 2009 and 2011, when the industry's employment fell by 74.2% (-2,296 jobs) as major power generating plants shut down. Meanwhile, the number of Electric Power Generation establishments in the region spiked at 70 in 2006 before declining to 26 in 2014. This number slowly but steadily increased to 40 by 2023 as new forms of energy are cultivated (Figure 1).

Despite significant losses of Electric Power Generation employment in the Metro Area between 2009 and 2011, the region has witnessed some notable increases of such employment over the past decade. Increases of employment during this period have been especially rapid in Wind Electric Power Generation, Solar Electric Power Generation, and Hydroelectric Power Generation. Biomass Electric Power Generation experienced a slight increase in employment levels over the past decade, while Fossil Fuel Electric Power Generation witnessed a slight decline in employment levels.
Check out Table 2 to get a sense of what occupations are high employing within select Electric Power Generation industries. One such occupation, Power Plant Operators, has approximately 160 jobs in the Metro Area. And the median wage is high, at $50.29.
| Table 2. U.S. Electric Power Generation Industry-Occupation Matrix | ||||
|---|---|---|---|---|
| Hydroelectric Power Generation | Fossil Fuel Electric Power Generation | Solar Electric Power Generation | Wind Electric Power Generation | Biomass Electric Power Generation |
| Power Plant Operators | Power Plant Operators | Solar Photovoltaic Installers | Wind Turbine Service Technicians | Power Plant Operators |
| Electrical Power-Line Installers and Repairers | Electrical Power-Line Installers and Repairers | Electricians | General and Operations Managers | First-Line Supervisors of Production and Operating Workers |
| Industrial Machinery Mechanics | Electrical Engineers | General and Operations Managers | Power Plant Operators | General and Operations Managers |
| Electrical Engineers | First-Line Supervisors of Mechanics, Installers, and Repairers | Project Management Specialists | First-Line Supervisors of Mechanics, Installers, and Repairers | Industrial Production Managers |
| First-Line Supervisors of Mechanics, Installers, and Repairers | First-Line Supervisors of Production and Operating Workers | First-Line Supervisors of Construction Trades and Extraction Workers | Business Operations Specialists, All Other | Industrial Machinery Mechanics |
| Source: Bureau of Labor Statistics, Industry-Occupation Matrix Data | ||||
To discover more about industry employment in the Twin Cities Metro Area, contact Tim O'Neill, Labor Market Analyst, at timothy.oneill@state.mn.us or visit CareerForceMN's Find a Job.