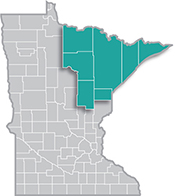
 Home to the state's second-largest metro, the Northeast Region has a strong industrial sector, tied largely to the area's abundant natural resources.
Most of the manufacturing base centers on mining and forest products industries. More than half of the sector's employment is in paper and machinery manufacturing.
Want the freshest data delivered by email? Subscribe to our regional newsletters.
4/23/2025 11:08:05 AM
Carson Gorecki
During times of potentially rapid changes in our economy, waiting several months for an update on conditions begins to feel like an eternity. Early in the COVID shutdown, there was a critical need for real-time data, or as close to real-time as possible. One form this took in our Labor Market Information Office was monthly and weekly unemployment insurance claims. DEED, in addition to operating our state's unemployment insurance (UI) claim system, also produces a rich array of data that details trends by a several characteristics such as industry, occupation, age, gender, education, race, origin and type of claim. UI claims data are especially useful because they require a shorter turnaround than some of our other data sources and are one of our best leading indicators, often moving before the more commonly shared unemployment rate.
UI claims are typically split into different types. Regular continued claims are those that have been filed for more than one week. Initial claims, by contrast are new, first-time filings for UI benefits. As a result, initial claims are better leading indicators. That said, UI claims are also volatile measures, are subject to substantial seasonal variation and fluctuate significantly. This is especially true for small areas like counties where the closure of a single employer can lead to significant spikes in claims.
Nonetheless UI claims can be extremely useful as one of our most timely measurement tools. As of the week ending March 22, the region registered just over 4,180 regular continued claims. By comparison, initial claims for the previous week totaled 279. That number may not mean much unless we compare it to a similar period for context. The week ending March 16, 2024 had 14 fewer initial claims. Regular continued claims, however, were up slightly (+20, +0.5%) over that same period (see Figure 1). Monthly initial and continued claims were up slightly, but roughly in line with the past three years. Excepting the drastic spike of claims of 2020 into 2021, monthly claims of both types were the highest since February 2016 (Figure 2).


As mentioned, UI claims are also available by industry. Given the inherent volatility of the weekly claims, the monthly data provide a more stable alternative. Historically, Construction accounts for the largest share of claims, especially over the winter months. This was the case in February initial and continued claims. Construction workers accounted for over half of the regular continued claims in the region (Figure 3). No other sector accounted for more than 6%, but the next largest shares were in Accommodation & Food Services, Manufacturing, Administrative & Waste Services, and Health Care & Social Assistance. Mining, a sector unique to the region and of particular interest given recent layoff announcements, will likely start to show up in larger numbers in the following weeks and months. The weekly claims are uniquely positioned to start picking up trends such as large layoffs.

Total claims and industries are just two ways to view DEED's UI claims. I encourage you to explore the monthly and weekly claims tools for more detail.
For additional information on how to interpret and analyze the different UI claims data available, visit How to Analyze Unemployment Insurance Statistics.
Contact Carson Gorecki at carson.gorecki@state.mn.us.
