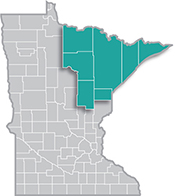
 Home to the state's second-largest metro, the Northeast Region has a strong industrial sector, tied largely to the area's abundant natural resources.
Most of the manufacturing base centers on mining and forest products industries. More than half of the sector's employment is in paper and machinery manufacturing.
Want the freshest data delivered by email? Subscribe to our regional newsletters.
Often when I present or write about wages, I make comparisons using the median of different industries or occupations.
8/27/2025 11:08:05 AM
Carson Gorecki
Often when I present or write about wages, I make comparisons using the median of different industries or occupations. This is a generally accepted practice, but leaves out some important context, namely how spread out wages are, both within and across groups. Fortunately, DEED's Occupational Employment & Wage Statistics (OEWS) offers 10th, 25th, 75th, and 90th percentile wages in addition to the very handy medians.
Using this data, we can see how some occupational groups like Food Preparation & Serving Related, Healthcare Support and Farming, Fishing & Forestry have much tighter wage ranges than others like Legal, Management and Protective Service (see Figure 1).

Along the wage distribution, the 75th percentile wage means that 75% of all workers employed in that role earn less than that figure. As a result, the 75th percentile is generally more representative of the wage that a more experienced or credentialed worker earns, while the 25th percentile can be a good estimate for a less experienced or newer worker earns in a role.
As such, the ratio of the 75th to the 25th percentile wages is a useful measure of relative wage diffusion. Across all occupations that ratio in Northeast Minnesota is 2.04 (see table 1). The highest ratio is for Legal occupations at 2.38 and the lowest is Farming, Fishing & Forestry occupations at 1.27. There are many reasons for the varying size of wage ranges. Much of the dispersion can be attributed to the types of jobs themselves and how they fit into typical career pathways.
Take Healthcare Support as an example. About 80% of employment in that occupational group is in Home Health and Personal Care Aides or Nursing Assistants. These two occupations pay below the regional median wage, and perhaps more relevant to the discussion of wage distribution, are often stepping stones to higher-paying occupations in healthcare that require more experience and training. Because of these occupations' position toward the beginning of the typical healthcare career pathway and the difficult nature of the work, tenure for Healthcare Support occupations is relatively low at 2.8 years. That is third-lowest among occupational groups.
Healthcare Support also has the second smallest 75th-25th wage percentile ratio at 1.29. In practical terms, this means that there is not a ton of room for workers to move up the pay scale within this occupational group. Many will opt to move into roles like Licensed Practical Nurses or Registered Nurses, which are in the separate Healthcare Practioners & Technical occupational group.
Conversely, the Legal occupational group contains the entire typical pathway. One entering the Legal field will often start as a Legal Assistant or Paralegal, perhaps hoping to eventually become a Lawyer, and potentially a Judge. Paralegals & Legal Assistants alone have a 75th-25th ratio of 1.5 and Lawyers are a bit higher with 2.0, but when you look at these occupations in the career pathways continuum as they tend to function, that ratio widens, and you get the larger 2.4 ratio for all Legal occupations. There is not a ton of wage growth potential as a Legal Assistant or Paralegal, but when the potential high wages attainable for Lawyers is included, there is a sizable increase in earning potential in the Legal field.
Another factor that could impact intra-occupational wage growth or distribution is the prevalance of union membership. Education, Training and Library occupations had the highest share of employment represented by unions nationally in 2024 at 35.8%, followed by Protective Service at 32.5%. These occupational groups are both in the top four of the 75th-25th wage ratio rankings. Contract agreements often stipulate regular wage increases, and while this may lag the private wage growth in the short run during times like the period of high inflation in 2021 and 2022, they also serve as a wage growth floor. Combined with well-defined routes of career advancement and above average tenure, this may explain the wider than average wage dispersion in these occupational groups.
Career advancement potential, tenure and union membership are only a few pieces of the wage distribution puzzle. They tell the story well for some occupational groups, and explain less in others. However, knowing what the typical wage growth potential is within a given field can be a useful piece of information for jobseekers and employers alike.
| Table 1. Wage Distribution, Tenure, and Union Membership by Occupational Group, Northeast Minnesota and U.S., 2024-2025 | |||
|---|---|---|---|
| Occupational Group | 75th to 25th Percentile Wage Ratio in NE MN, 2025 | Median Years with Current Employer in US, 2024 | Percent of Employed Represented by Unions in US, 2024 |
| Legal | 2.38 | 4 | 7% |
| Total, All Occupations | 2.04 | 3.9 | 11% |
| Protective service | 1.99 | 5.2 | 33% |
| Management | 1.94 | 5.7 | 5% |
| Education, training and library | 1.89 | 5.3 | 36% |
| Arts, design, entertainment, sports and media | 1.83 | 3.5 | 8% |
| Installation, maintenance and repair | 1.73 | 3.9 | 14% |
| Computer and mathematical | 1.71 | 4.3 | 5% |
| Transportation and material moving | 1.70 | 3.2 | 14% |
| Healthcare practitioners and technical | 1.62 | 4.3 | 14% |
| Business and financial operations | 1.59 | 4.5 | 5% |
| Life, physical and social science | 1.58 | 3.7 | 12% |
| Sales and related | 1.57 | 3.3 | 3% |
| Personal care and service | 1.57 | 2.5 | 5% |
| Community and social service | 1.56 | 4.3 | 15% |
| Office and administrative support | 1.51 | 3.6 | 10% |
| Construction and extraction | 1.47 | 4.1 | 16% |
| Architecture and engineering | 1.45 | 4.9 | 7% |
| Building and grounds cleaning and maintenance | 1.43 | 3.5 | 10% |
| Food preparation and serving related | 1.40 | 2 | 5% |
| Healthcare support | 1.29 | 2.8 | 9% |
| Farming, fishing, and forestry | 1.28 | 5.1 | 2% |
| Source: DEED OEWS, BLS | |||
For more information about wages in Northeast Minnesota, contact Carson Gorecki at Carson.Gorecki@state.mn.us.
