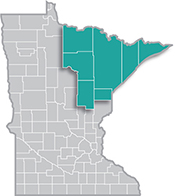
 Home to the state's second-largest metro, the Northeast Region has a strong industrial sector, tied largely to the area's abundant natural resources.
Most of the manufacturing base centers on mining and forest products industries. More than half of the sector's employment is in paper and machinery manufacturing.
Want the freshest data delivered by email? Subscribe to our regional newsletters.
3/31/2025 11:08:05 AM
Carson Gorecki
In celebration of Women's History Month, this blog includes some trends and characteristics of women in Northeast Minnesota's workforce. As of 2024, women accounted for nearly 71,900 jobs, or 51% of all jobs in the region. Interestingly, women in Northeast Minnesota have held more jobs than men since 2015 and for 23 of the last 24 years (see Figure 1). The peak of the female employment share in the region came in 2010, the culmination of a trend of increased labor force participation of women that had been building nationally since the 1940s. Since 2010, female labor force participation plateaued and even began to decline slightly.

Despite a higher employment share, the female labor force was smaller than the male labor force in Northeast Minnesota as of 2023. Of the around 161,000 workers in the region, just under 77,000 were women, compared to 84,500 men. Similarly, the female participation rate (57.2%) was four percentage points lower than the male rate (61.4%). On the other hand, women in the region had a lower rate of unemployment compared to men (3.6% vs. 4.3%). While not available at a regional level, national data shows that women are also more likely to hold more than one job.
The total jobs numbers and shares mask significant variation in employment patterns across occupations and industries. By industry, women are much more likely to be employed in service-providing sectors such as Health Care & Social Assistance, Finance & Insurance and Educational Services. The Health Care & Social Assistance sector is the largest in the region and accounts for nearly one out of every four total jobs and more than 36% of all jobs held by women. Within the sector, women are even more concentrated in the Social Assistance, Hospitals, Ambulatory Health Care Services and Nursing Residential Care Facilities industries, where they fill more than 75% of jobs. Outside of Health Care & Social Assistance, women workers are also very highly concentrated in specific types of retailers, insurance and credit intermediation, and human resources industries (see Table 1).
| Table 1. Female Employment by Industry in Northeast Minnesota, 2023 | ||
|---|---|---|
| Industry | Employment | Percent of Industry Total |
| Private Households | 180 | 82.9% |
| Social Assistance | 4,345 | 77.2% |
| Hospitals | 10,520 | 77.1% |
| Ambulatory Health Care Services | 4,632 | 76.7% |
| Clothing, Clothing Accessories, Shoe, and Jewelry Retailers | 468 | 75.9% |
| Nursing and Residential Care Facilities | 6,720 | 75.7% |
| Health and Personal Care Retailers | 450 | 73.6% |
| Insurance Carriers and Related Activities | 1,042 | 71.5% |
| Credit Intermediation and Related Activities | 1,315 | 71.2% |
| Administration of Human Resource Programs | 262 | 71.2% |
| Total, All Industries | 71,869 | 51.0% |
| Repair and Maintenance | 169 | 15.3% |
| Plastics and Rubber Products Manufacturing | 59 | 15.0% |
| Construction of Buildings | 303 | 13.0% |
| Building Equipment Contractors | 245 | 12.6% |
| Specialty Trade Contractors | 514 | 12.4% |
| Forestry and Logging | 51 | 12.1% |
| Foundation, Structure, and Building Exterior Contractors | 122 | 12.0% |
| Primary Metal Manufacturing | 34 | 10.3% |
| Mining, Quarrying, and Oil and Gas Extraction | 362 | 9.5% |
| Nonresidential Building Construction | 104 | 9.2% |
| Source: US Census Bureau QWI | ||
A lot of the female employment concentration in specific industries is in turn attributable to occupational patterns. The stereotypical example that may come to mind is nurses. Data is limited at the local level, but statewide, women make up more than 90% of Registered Nurses and more than 80% of Nursing Assistants, Licensed Practical Nurses and Nurse Practitioners.1 Nurses account for a significant share of Health Care sector employment and so it follows that women are highly concentrated in that sector. Women are also much more likely than men to be Preschool & Kindergarten Teachers (98%), Dental Assistants (98%), Mental Health Counselors (93%), Paralegals (93%) and Childcare Workers (89%), among many others
While women are much more likely to work in certain service-providing sectors and occupations, they are much less likely to employed in what we call goods-producing sectors. These sectors include businesses in Construction, Manufacturing and resource extraction. Only 9% of Mining sector workers are women, while Construction employment is 13% women. The smaller Forestry & Logging industry also has a relatively low female employment share at 12.1%.
However, female representation has been increasing in these industries over time. By comparison, the share of women workers in Construction was at 9.7% in 2000. The data on Mining is limited, but statewide in 2000 women accounted for 7.9% of jobs. In contrast, Manufacturing, which in 2023 was 23% women, had a lower share than in 2000 (25.1%).
Finally, there is the subject of wages. The gender pay gap still exists but continues to narrow. In Northeast Minnesota as of 2022, the female median hourly wage equated to 80.7% of the male median (see Table 2). That ratio was up from 75% in 2012, meaning that the female median wage grew about ten percentage points faster than the male median over that period. According to data from the Quarterly Employment Demographics program, wage parity by sex was greatest in Accommodation & Food Services, Arts, Entertainment & Recreation, Educational Services and Health Care & Social Assistance. The largest gaps existed for women working in Finance & Insurance, Agriculture, Forestry, Fishing & Hunting and Construction. Wages grew the fastest for women working in Management of Companies, Accommodation & Food Services and Retail Trade.
| Table 2. Wage Statistics by Sex and Industry in Northeast Minnesota, 2012-2022 | ||||
|---|---|---|---|---|
| Industry | 2022 Median Hourly Wage | Percent of Male Wage | 2012-2022 Wage Growth | Percent of Total Employment |
| Male Total | $25.89 | 100% | +40% | 50% |
| Female Total (Female industry details below) | $20.89 | 81% | +50% | 50% |
| Mining | $52.95 | 93% | +62% | 8% |
| Utilities | $40.97 | 73% | +27% | 26% |
| Professional and Technical Services | $27.28 | 73% | +63% | 48% |
| Public Administration | $27.05 | 93% | +35% | 43% |
| Management | $26.37 | 96% | +135% | 59% |
| Finance and Insurance | $26.34 | 61% | +59% | 68% |
| Construction | $24.88 | 70% | +53% | 12% |
| Transportation and Warehousing | $24.19 | 87% | +29% | 20% |
| Health Care and Social Assistance | $23.47 | 97% | +52% | 78% |
| Manufacturing | $22.50 | 77% | +45% | 21% |
| Wholesale Trade | $22.03 | 79% | +52% | 22% |
| Educational Services | $22.00 | 98% | +16% | 68% |
| Real Estate and Rental and Leasing | $18.43 | 92% | +61% | 46% |
| Information | $18.16 | 88% | +22% | 45% |
| Arts, Entertainment, and Recreation | $16.82 | 99% | +47% | 48% |
| Other Services, Ex. Public Admin | $16.50 | 79% | +54% | 56% |
| Administrative and Waste Services | $16.49 | 88% | +67% | 38% |
| Accommodation and Food Services | $16.32 | 102% | +83% | 58% |
| Retail Trade | $16.00 | 95% | +74% | 49% |
| Agriculture, Forestry, Fishing & Hunting | $14.99 | 66% | +55% | 26% |
| Source: DEED Quarterly Employment Demographics | ||||
Data clearly shows that women are vital economic contributors and fill half of our region's jobs. They work in every sector, but are more concentrated in specific service-providing industries and occupations. And while our economy has been moving in the direction of employment and pay equality, disparities remain. Some sectors remain less accessible and/or appealing to half of our workforce. While extremely diverse, women make up a group that could be a crucial source of workers for employers still struggling to hire. Thank you to all our working women out there!
For more information on employment trends in Northeast Minnesota, contact Carson Gorecki at carson.gorecki@state.mn.us.
1Source: Steven Ruggles, Sarah Flood, Matthew Sobek, Daniel Backman, Grace Cooper, Julia A. Rivera Drew, Stephanie Richards, Renae Rodgers, Jonathan Schroeder, and Kari C.W. Williams. IPUMS USA: Version 16.0 [dataset]. Minneapolis, MN: IPUMS, 2025. https://doi.org/10.18128/D010.V16.0
