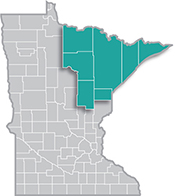
 Home to the state's second-largest metro, the Northeast Region has a strong industrial sector, tied largely to the area's abundant natural resources.
Most of the manufacturing base centers on mining and forest products industries. More than half of the sector's employment is in paper and machinery manufacturing.
Want the freshest data delivered by email? Subscribe to our regional newsletters.
12/23/2024 2:33:24 PM
Carson Gorecki
As we transition into the long winter here in Northeast Minnesota, I am taking the occasion to ponder seasonality. More specifically, I was interested in which industries see their employment vary the most over the course of a year. There are some that probably jump to mind right away, and many of those do show up toward the top of the seasonality rankings, but others may be more surprising.
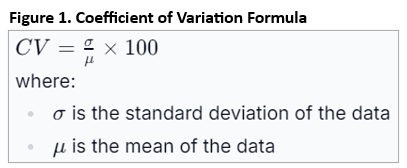
 To measure seasonality, I had the computer calculate coefficients of variation (CVs) for quarterly industry employment for the last five years (2019-2023). The standard deviation was divided into the average of quarterly employment for each year and then averaged over the five years to diminish the effect of any single year on the outcome. The CV is meant to represent how much employment changes quarter-to-quarter, relative to the average. The larger the CV, the higher the seasonal variation.
At the top of the list in Northeast Minnesota by a sizeable margin was Crop Production, with a 5-year CV of 55.3 (see Table 1). This is perhaps no surprise given the relatively limited outdoor growing season in our region. The peak employment quarter was Quarter 2 (Q2) in April, May and June, typically when planting is occurring. The low employment quarter was Q1 (January-March), the depth of our frigid winter.
Close to each other in second and third place were Motion Picture & Sound Recording Industries and Rental & Leasing Services. Filming hiring ramps up in the third quarter of July, August, and September when the cast and crew will not freeze. However, those films that are set in the winter – as many shot locally are – need to get creative with their snow or extend into Q4 and Q1. Rental & Leasing seasonal variability is due to relatively large employment increases in Q2 and Q3 in the Consumer Goods Rental sub-industry, reflecting increased demand for household and recreational items.
Heavy & Civil Engineering Construction was also in the top five for seasonality, confirming that there is such a thing as road construction season in Minnesota, which we all already knew. It occurs mostly in the late summer/early fall. Interestingly, Warehousing & Storage was the only industry in the top 10 with a peak in Q4, when retail sales are highest. Forestry & Logging was the only industry peaking in Q1 when the frozen ground allows for easier movement to-and-with cut timber. Conversely, Water Transportation can only happen when that water is not frozen and reflects the Great Lakes shipping season. Three Leisure & Hospitality industries finish out the top 10, all peaking in the summer and early fall along with the tourism season.
Then there are those industries that hardly fluctuate at all over the year. The industry that varied the least was Gasoline Stations & Fuel Dealers (see Table 1). The difference between the average maximum and minimum quarters was only 32 jobs over the last five years, when the average employment level was over 2,500. There was also relatively little seasonal variability among Justice, Public Order & Safety Activities, Utilities, and Merchant Wholesalers, Durable Goods, and the Health Care & Social Assistance sector. Demand for these types of goods and services are less determined by the changing of the seasons/weather. Higher fuel and energy costs may be exceptions, but they do not appear to translate to corresponding changes in overall employment levels in Utilities and Gas Stations & Fuel Dealers.
| Table 1. Seasonal Employment Variation by Industry in Northeast Minnesota, 2019-2023 | |||||||
|---|---|---|---|---|---|---|---|
| Seasonal Variability Rank | Industry Title | Average Coefficient of Variation | Average Employment | Average Minimum Employment | Average Maximum Employment | Typical Peak Quarter of Employment | Typical Low Quarter of Employment |
| 1 | Crop Production | 55.28 | 78 | 43 | 137 | Q2 | Q1 |
| 2 | Motion Picture & Sound Recording Industries | 25.44 | 126 | 100 | 154 | Q3 | Q2 |
| 3 | Rental & Leasing Services | 24.19 | 264 | 197 | 345 | Q3 | Q1 |
| 4 | Heavy & Civil Engineering Construction | 20.41 | 1,718 | 1,273 | 2,110 | Q3 | Q1 |
| 5 | Warehousing & Storage | 19.69 | 202 | 179 | 246 | Q4 | Q2 |
| 6 | Forestry & Logging | 19.61 | 392 | 299 | 480 | Q1 | Q2 |
| 7 | Water Transportation | 19.18 | 203 | 147 | 237 | Q3 | Q1 |
| 8 | Accommodation | 17.55 | 3,205 | 2,609 | 3,885 | Q3 | Q1 |
| 9 | Performing Arts, Spectator Sports, & Related Industries | 16.85 | 309 | 253 | 363 | Q3 | Q2 |
| 10 | Museums, Historical Sites, & Similar Institution | 16.76 | 328 | 262 | 393 | Q3 | Q1 |
| - | Total, All Industries | 2.58 | 137,025 | 132,231 | 140,293 | Q3 | Q1 |
| 101 | Hospitals | 1.57 | 13,190 | 13,002 | 13,453 | Q1 | Q2 |
| 102 | Wholesale Trade | 1.53 | 2,856 | 2,809 | 2,906 | Q3 | Q2 |
| 103 | Fabricated Metal Product Manufacturing | 1.53 | 775 | 761 | 788 | Q2 | Q3 |
| 104 | Credit Intermediation & Related Activities | 1.43 | 1,967 | 1,931 | 1,993 | Q1 | Q4 |
| 105 | Professional, Scientific, & Technical Services | 1.39 | 4,532 | 4,468 | 4,612 | Q1 | Q2 |
| 106 | Health Care & Social Assistance | 1.21 | 33,034 | 32,617 | 33,533 | Q1 | Q2 |
| 107 | Merchant Wholesalers, Durable Goods | 1.10 | 1,612 | 1,594 | 1,634 | Q1 | Q2 |
| 108 | Utilities | 0.84 | 1,458 | 1,443 | 1,474 | Q3 | Q1 |
| 109 | Justice, Public Order, & Safety Activities | 0.57 | 1,118 | 1,111 | 1,125 | Q4 | Q3 |
| 110 | Gasoline Stations & Fuel Dealers | 0.56 | 2,506 | 2,487 | 2,519 | Q3 | Q1 |
| Source: DEED Quarterly Census of Employment and Wages | |||||||
There are many reasons why a good understanding of employment seasonality matters. From a jobseeker's perspective, they may want to know which industries are most likely to be hiring in a specific quarter. Think of the teacher that needs some summer employment while school is out, or the construction laborer who is looking for other work while demand for projects slows in the winter. Or maybe they just want to be done with the cyclical nature of their jobs and want the relatively steady employment of a gas station or courtroom. From a researcher's or economist's perspective it is good to know when (and whether) certain industries are likely to be down or up and this is often factored into what we refer to as seasonal adjustment of employment. Whatever the reason for the season(ality), it is nice – and maybe useful – to know each industry's unique annual variability.
Contact Carson Gorecki at carson.gorecki@state.mn.us.