 The presence of such industry powerhouses as Polaris, Arctic Cat and New Flyer make Northwest Minnesota a hub of transportation equipment manufacturing.
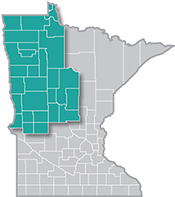
From wheat and potatoes to soybeans and sugar beets, the region is a major producer and processor of food staples and specialty agricultural products.
Want the freshest data delivered by email? Subscribe to our regional newsletters.
3/31/2025 11:40:37 AM
Anthony Schaffhauser, James Whirlwind Soldier
My July 2023 blog demonstrated how workforce diversity boosted Northwest Minnesota's labor force in the pandemic recovery. But what is the economic impact of increased labor force participation among diverse populations? This question gets right to DEED's mission: "To empower the growth of the Minnesota economy, for everyone." Here I want to emphasize "everyone." The old cliché, "we all do better when we all do better" is not only catchy, but it is also proven true in economics.
To show this, let's consult an academic journal. My colleague Fernando Quijano from the University of Minnesota Extension had his recent paper accepted for publication in the Community Development Journal, and uses math to relate the employment-to-population ratio (EP) to real gross domestic product (GDP). Here's the formula:

EP is the number of employed people divided by the population. In this formula, it is represented by Workers/Population.
In all, this formula is just showing that GDP increases when worker productivity increases, worker hours increase or EP increases. So, the basic economics of GDP is that the way the economy can grow is for more people to work more and be more productive at that work. When put plainly, it sounds simple, right?
So, what does this mean for Northwest Minnesota? Again, it's easy in theory. Just increase EP and productivity and you grow the economy. Of course, working more hours can also increase GDP, but given the desirability of work-life balance, this might not increase worker well-being.
Of those options, data shows that the Northwest region has a huge opportunity to increase EP. Given that Northwest Minnesota had 1.4 job vacancies for every unemployed worker in 2023 (14,193 vacancies for 10,181 unemployed workers), the job market can support increased labor force participation. Just look at the unemployment and labor force participation rates by race and ethnicity in Table 1. Higher labor force participation and/or lower unemployment would increase EP.
| Table 1. Northwest Minnesota Employment Characteristics, 2019 - 2023 | |||||
|---|---|---|---|---|---|
| - | Northwest Minnesota | Minnesota | |||
| In Labor Force (available workers) | Labor Force Partic. Rate | Unemp. Rate | Labor Force Partic. Rate | Unemp. Rate | |
| Total Labor Force | 290,223 | 63.0% | 4.3% | 68.5% | 3.9% |
| 16 to 19 years | 17,034 | 57.2% | 7.6% | 52.7% | 9.9% |
| 20 to 24 years | 27,776 | 83.7% | 6.8% | 83.4% | 6.5% |
| 25 to 44 years | 114,038 | 87.5% | 4.4% | 88.7% | 3.5% |
| 45 to 54 years | 53,282 | 85.9% | 3.4% | 87.8% | 2.9% |
| 55 to 64 years | 56,733 | 68.8% | 2.9% | 72.8% | 3.0% |
| 65 to 74 years | 18,249 | 25.6% | 4.3% | 27.8% | 3.4% |
| 75 years & over | 3,140 | 6.1% | 3.3% | 6.6% | 3.1% |
| Employment Characteristics by Race & Hispanic Origin | |||||
| White alone | 260,145 | 62.7% | 3.7% | 67.5% | 3.4% |
| Black or African American | 3,501 | 71.2% | 11.3% | 71.0% | 8.4% |
| American Indian & Alaska Native | 7,538 | 58.1% | 14.5% | 57.7% | 11.4% |
| Asian or Other Pac. Islanders | 2,270 | 61.5% | 4.0% | 74.6% | 3.5% |
| Some Other Race | 3,483 | 73.1% | 5.3% | 75.9% | 5.6% |
| Two or More Races | 13,326 | 69.4% | 7.8% | 74.2% | 6.1% |
| Hispanic or Latino | 9,592 | 77.2% | 8.9% | 77.1% | 5.9% |
Source: Census Bureau American Community Survey, 2019 to 2023 five-year estimates
This raises a basic question: why is labor force participation lower for youth, American Indians and Asian or Other Pacific Islanders in the region? And why is the unemployment rate lower for white workers than for every other racial and ethnic group in the region?
Truly understanding this pattern of labor force participation and unemployment – and narrowing the gap – would have a huge economic impact. Just think about the economic impact if all these groups matched the labor force participation rate of the Hispanic or Latino population, which is the highest in the region at 77.2%, and matched the unemployment rate of white workers, which is the lowest in the region at 3.7%.
Quijano writes in his conclusion, "To improve well-being, the formula [in Figure 1] underscores the importance of sustaining participation and fostering productivity." So, economics shows that effective workforce development grows the economy. That is because wages are a measure of value added, and value added is a source of economic growth. If all unemployed instead employed and earning wages, that would significantly increase the region's GDP. And, if many of those not currently in the labor force were also employed, GDP would be boosted a great deal more. Increasing labor force participation and worker productivity – workforce development – is economic development!
Contact Anthony Schaffhauser at Anthony.schaffhauser@state.mn.us.
