MN PMP Statistics

Medications dispensed for Opioid Use Disorder - MN

MN PMP MOUD Dispensation Dashboard

This NEW dashboard displays Medications for Opioid Use Disorder (MOUD) dispensed to Minnesota residents. Use the interactive maps to view dispensations of MOUD in Minnesota by patient location and corresponding prescriber location. View data by volume per MN county as well as rate per 1,000 residents. (Population counts per U.S. Census Bureau, Population Division. Annual Estimates of the Resident Population for Counties in Minnesota. 2019 to 2025. https://www.census.gov/programs-surveys/popest/data/tables.html)

Updated through Quarter 2, 2026.

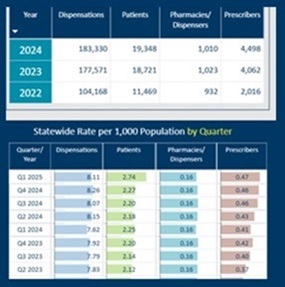
Feature image for MN PMP Annual Reports

MN PMP Annual Reports

Most recent: 2024, published September 2025.

Feature image for MN PMP Data Dashboard

MN PMP Data Dashboard

Dashboard allows you to filter dispensation data by county, payment type, prescription type, drug schedules, and quarter.
*Annual totals may differ between quarterly dashboard and PMP Annual Report due to ongoing prescription error corrections and resubmission. 

updated 8/14/2026
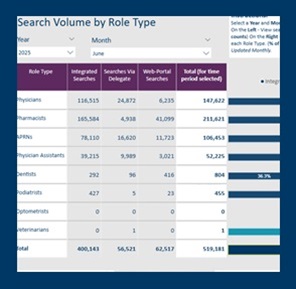
Feature image for MN PMP Utilization Dashboard

MN PMP Utilization Dashboard

This dashboard shows historic details going back to 2019 with limited 2018 data. 

Historic utilization data is available in the Previous MN PMP Reports link below.

Updated through July 2026.


click here for Previous MN PMP Reports

Access all previous reports published by the Minnesota PMP. This includes quarterly dispensation data prior to 2022,  monthly utilization reports 2015-2018, Annual Reports 2014-2024, and Year-to-Date reports (reported dispensations 2013-2016, prior to quarterly reports.)